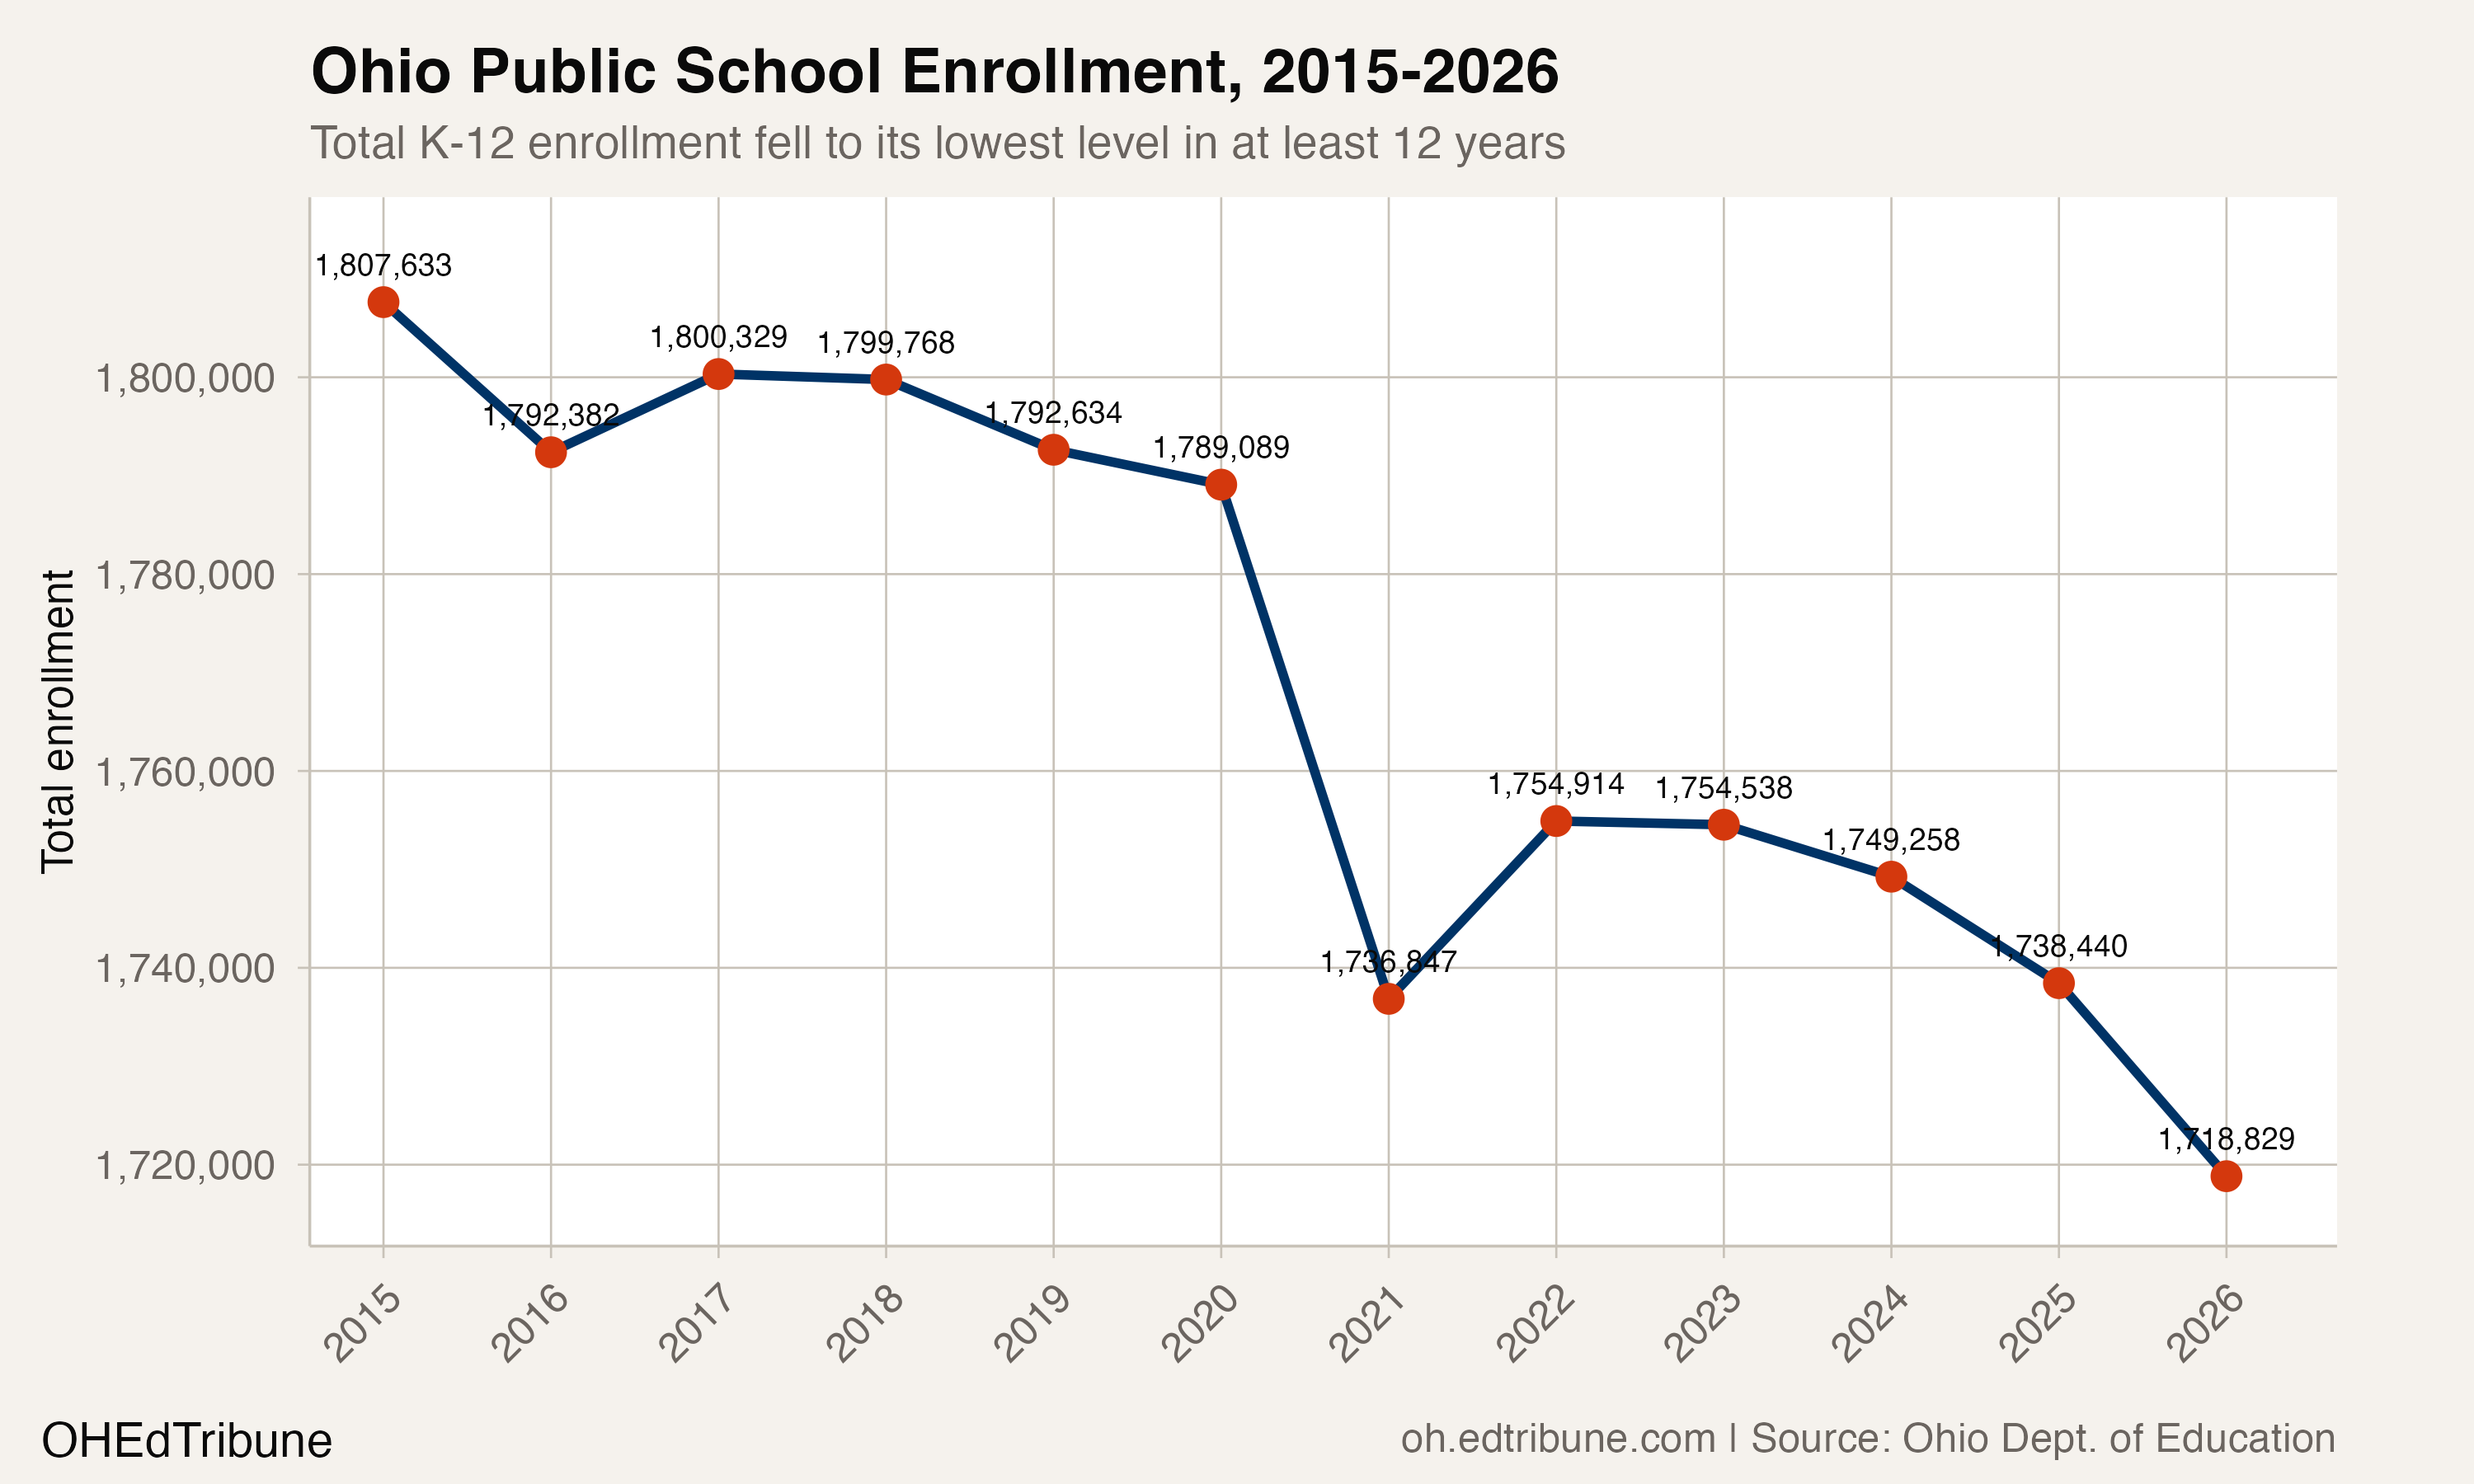
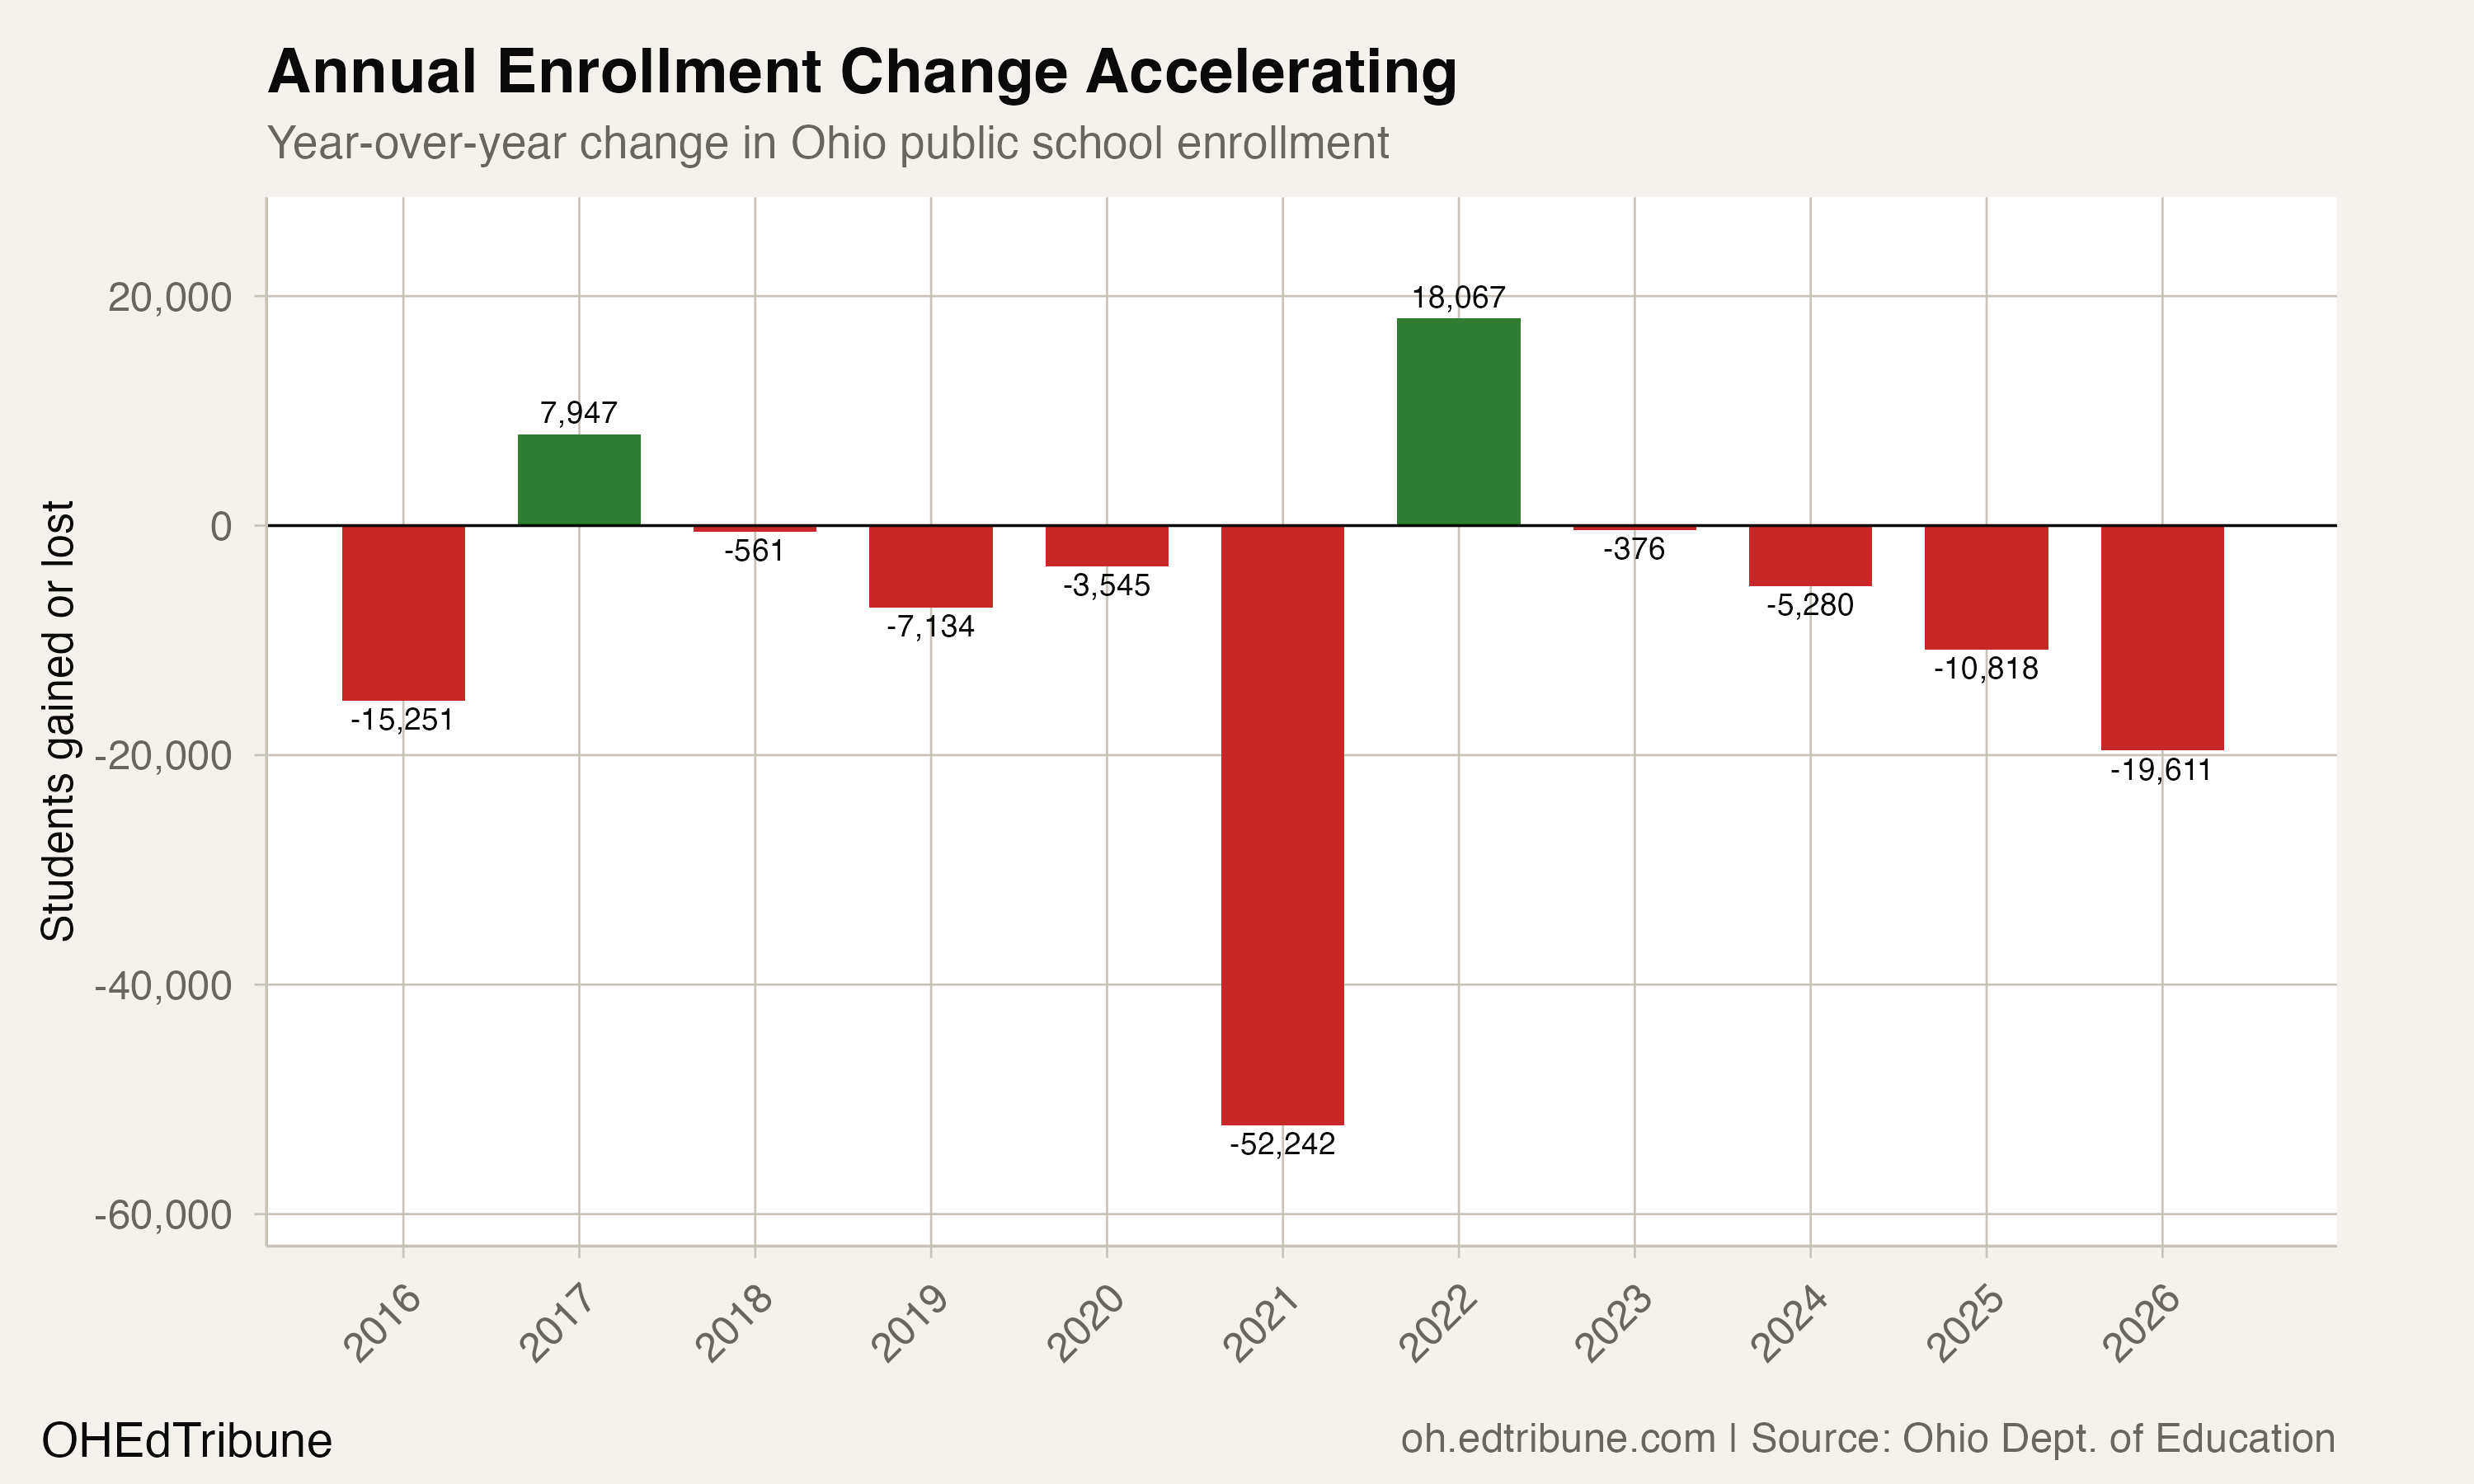
Ohio lost 19,611 public school students in 2025-26. That is the second-largest single-year drop in at least 12 years, trailing only the pandemic plunge of 52,242 in 2020-21. What separates 2025-26 from prior years is not the direction — Ohio has been shrinking, with interruptions, for most of the past decade. It is the pace. Since 2022-23, when the state shed just 376 students, annual losses have escalated sharply: 5,280 the next year, then 10,818, then 19,611.
The result is a new floor. At 1,718,829 students, Ohio's public school enrollment is the lowest recorded in the dataset, which begins in 2014-15. The state has shed 88,804 students since that peak, a 4.9% decline that erases a mid-sized suburban district's worth of enrollment every two years.
Faster than COVID's aftermath
The acceleration is the story, not the decline itself. Ohio's pre-pandemic trajectory was one of gentle erosion: averaging roughly 3,700 fewer students per year between 2014-15 and 2019-20. COVID shattered that baseline with a single-year loss of 52,242. A partial bounce of 18,067 in 2021-22 suggested recovery. It did not last.
The four-year post-bounce total is 36,085 students lost, 69.1% of the COVID-era loss compressed into a period with no pandemic to blame.
The 2025-26 loss alone, at 19,611, is 5.3 times larger than Ohio's pre-COVID annual average. The state is not returning to its old trajectory. It is building a new, steeper one.
Where the students left
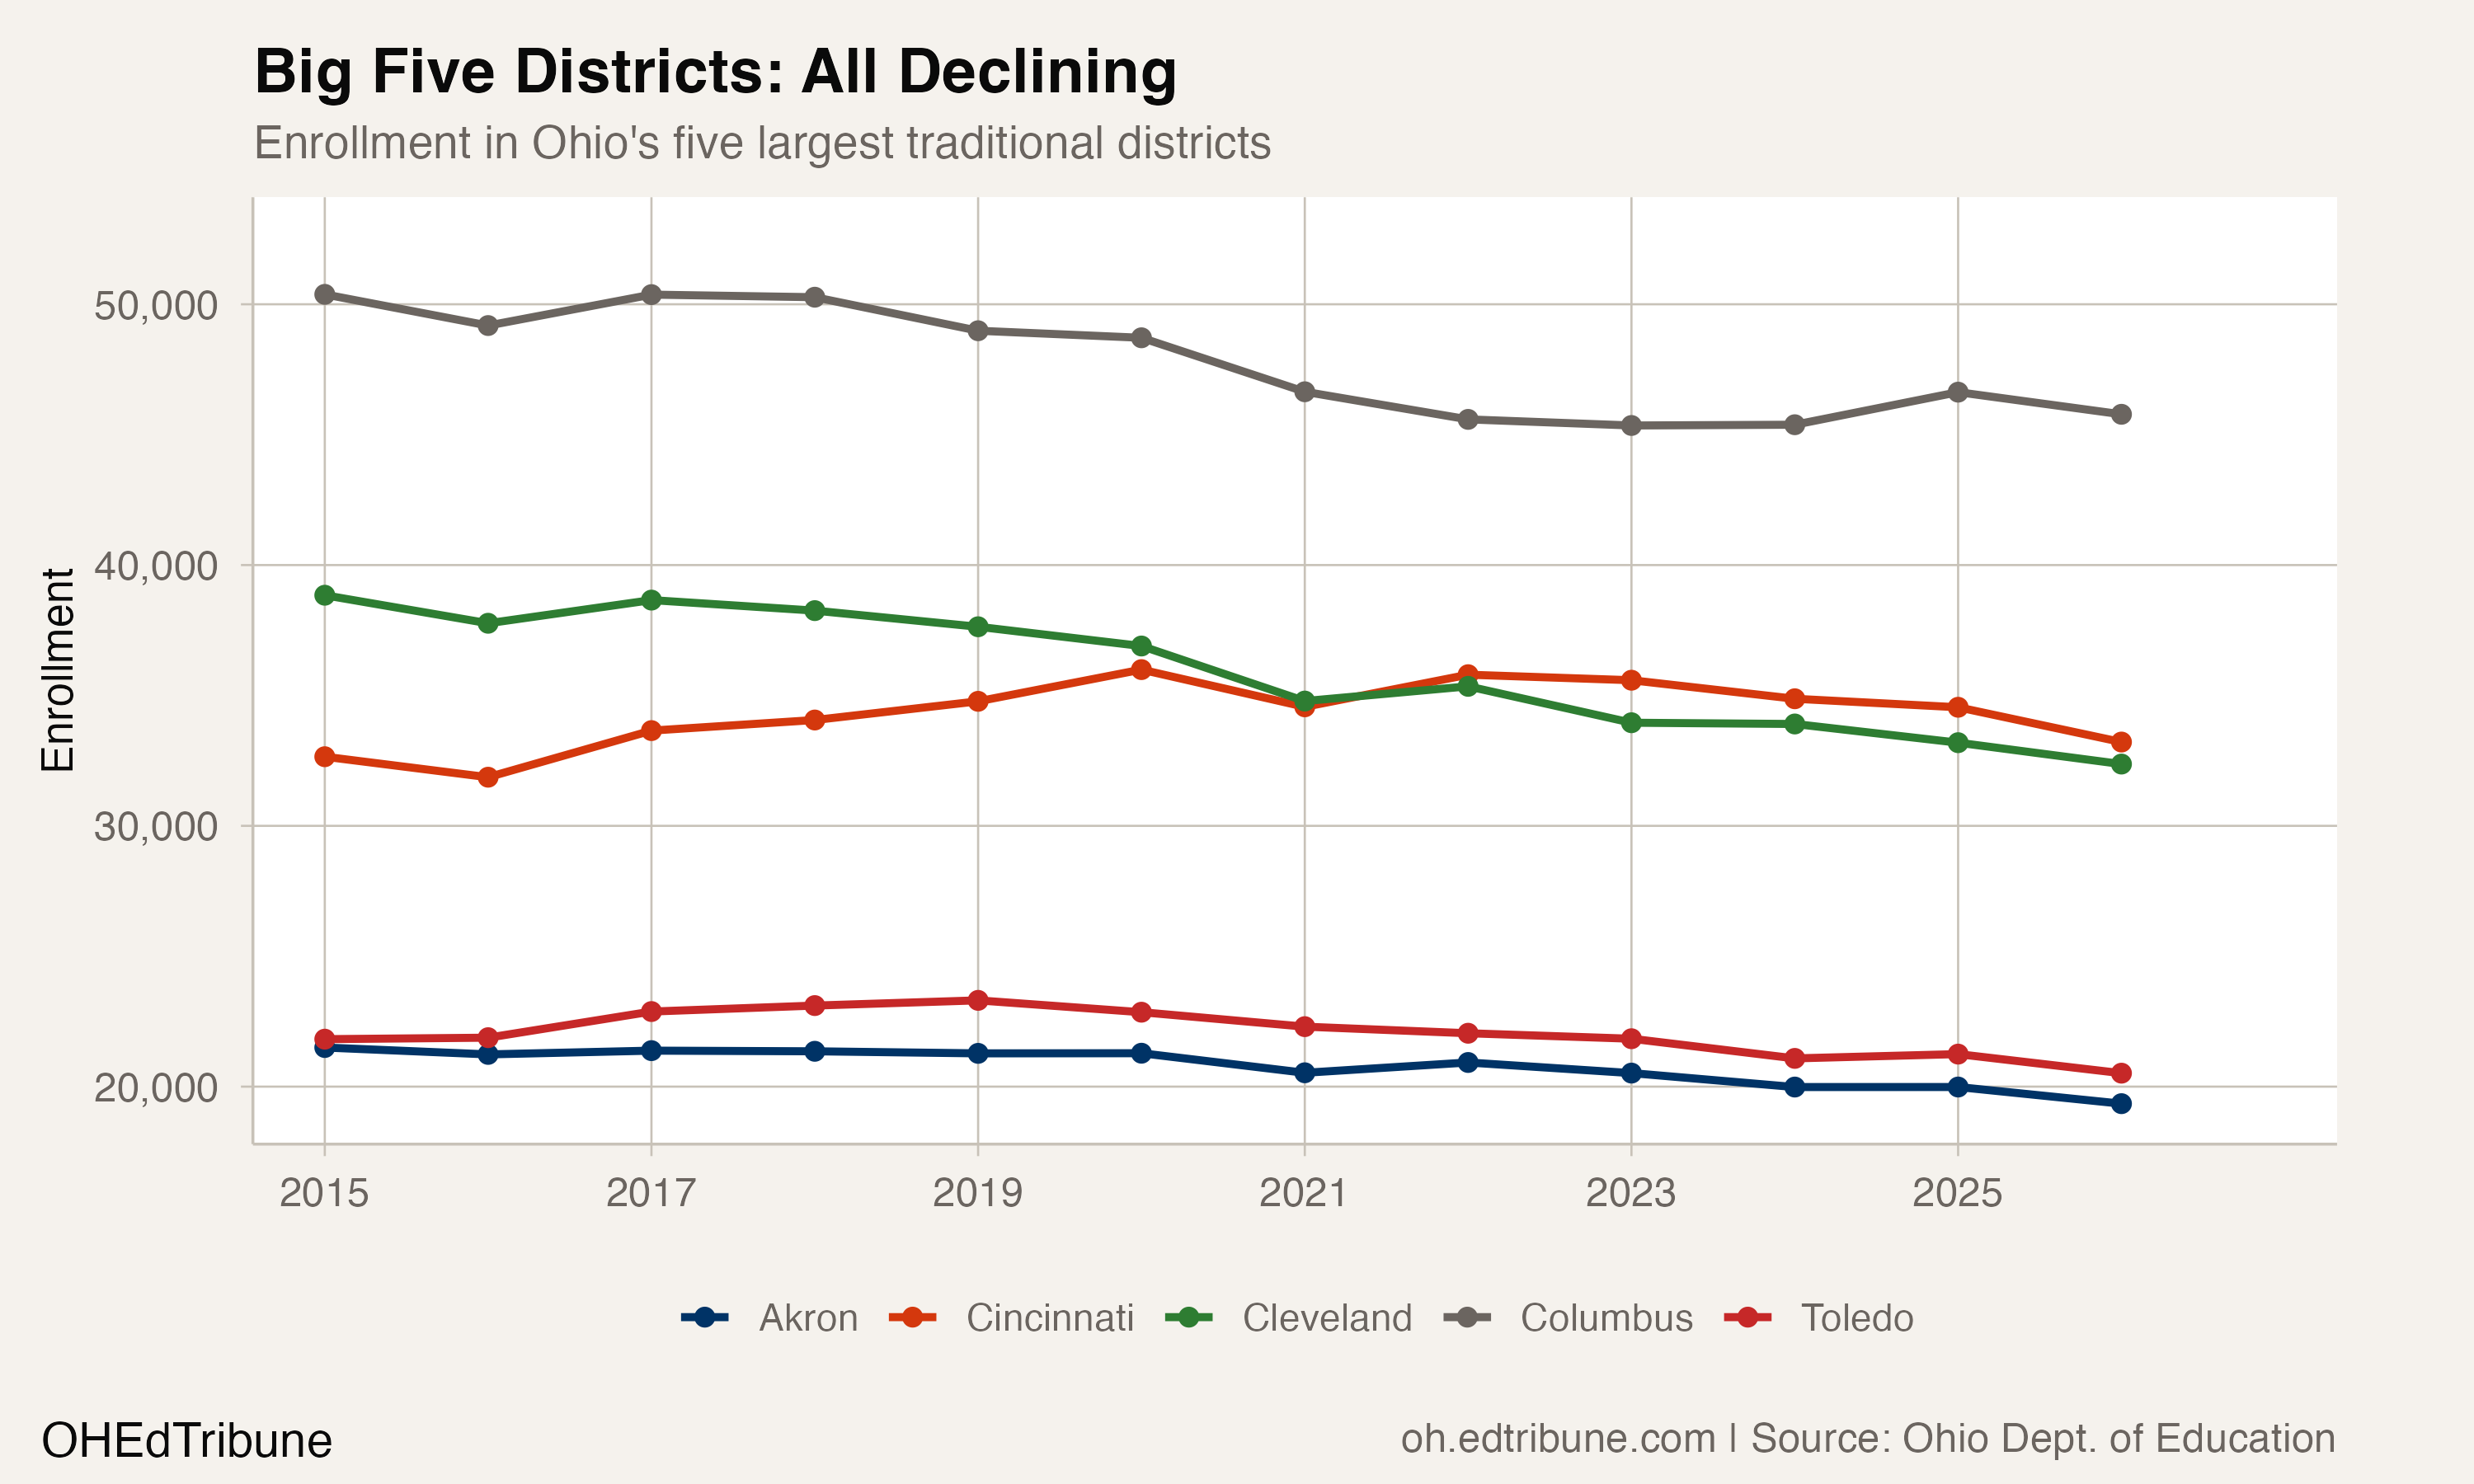
Ohio's five largest traditional districts collectively lost 4,372 students in a single year. Cincinnati Public Schools↗ET led with a loss of 1,334 students, a 3.9% decline. Columbus City Schools District↗ET lost 849, Cleveland Municipal↗ET lost 820, Toledo City↗ET lost 731, and Akron City↗ET lost 638.
But the losses extend far beyond the Big Five. Of the 963 districts with comparable data in both 2025 and 2026, 599 lost students and 349 gained. Among the 926 districts with at least five years of data, 384 are now at their all-time enrollment low, 41.5% of the total.
Cincinnati's situation illustrates the fiscal consequences. The district faces a $50 million budget gap as state funding falls short of projections. Treasurer Jennifer Wagner described the cuts bluntly:
"The central office has been cut. We cut deeply last year and we're having to cut some more this year. It makes it hard to serve the students for high-quality service when we're losing bodies." — Spectrum News 1, June 2025
Cleveland is responding with infrastructure contraction. The district's Board approved closing or merging 29 of its 88 schools by 2026-27, a consolidation driven by enrollment that has fallen roughly 50% over the past two decades.
Three forces, one direction
Three structural forces are converging to produce the acceleration, and distinguishing among them matters because each implies different responses.
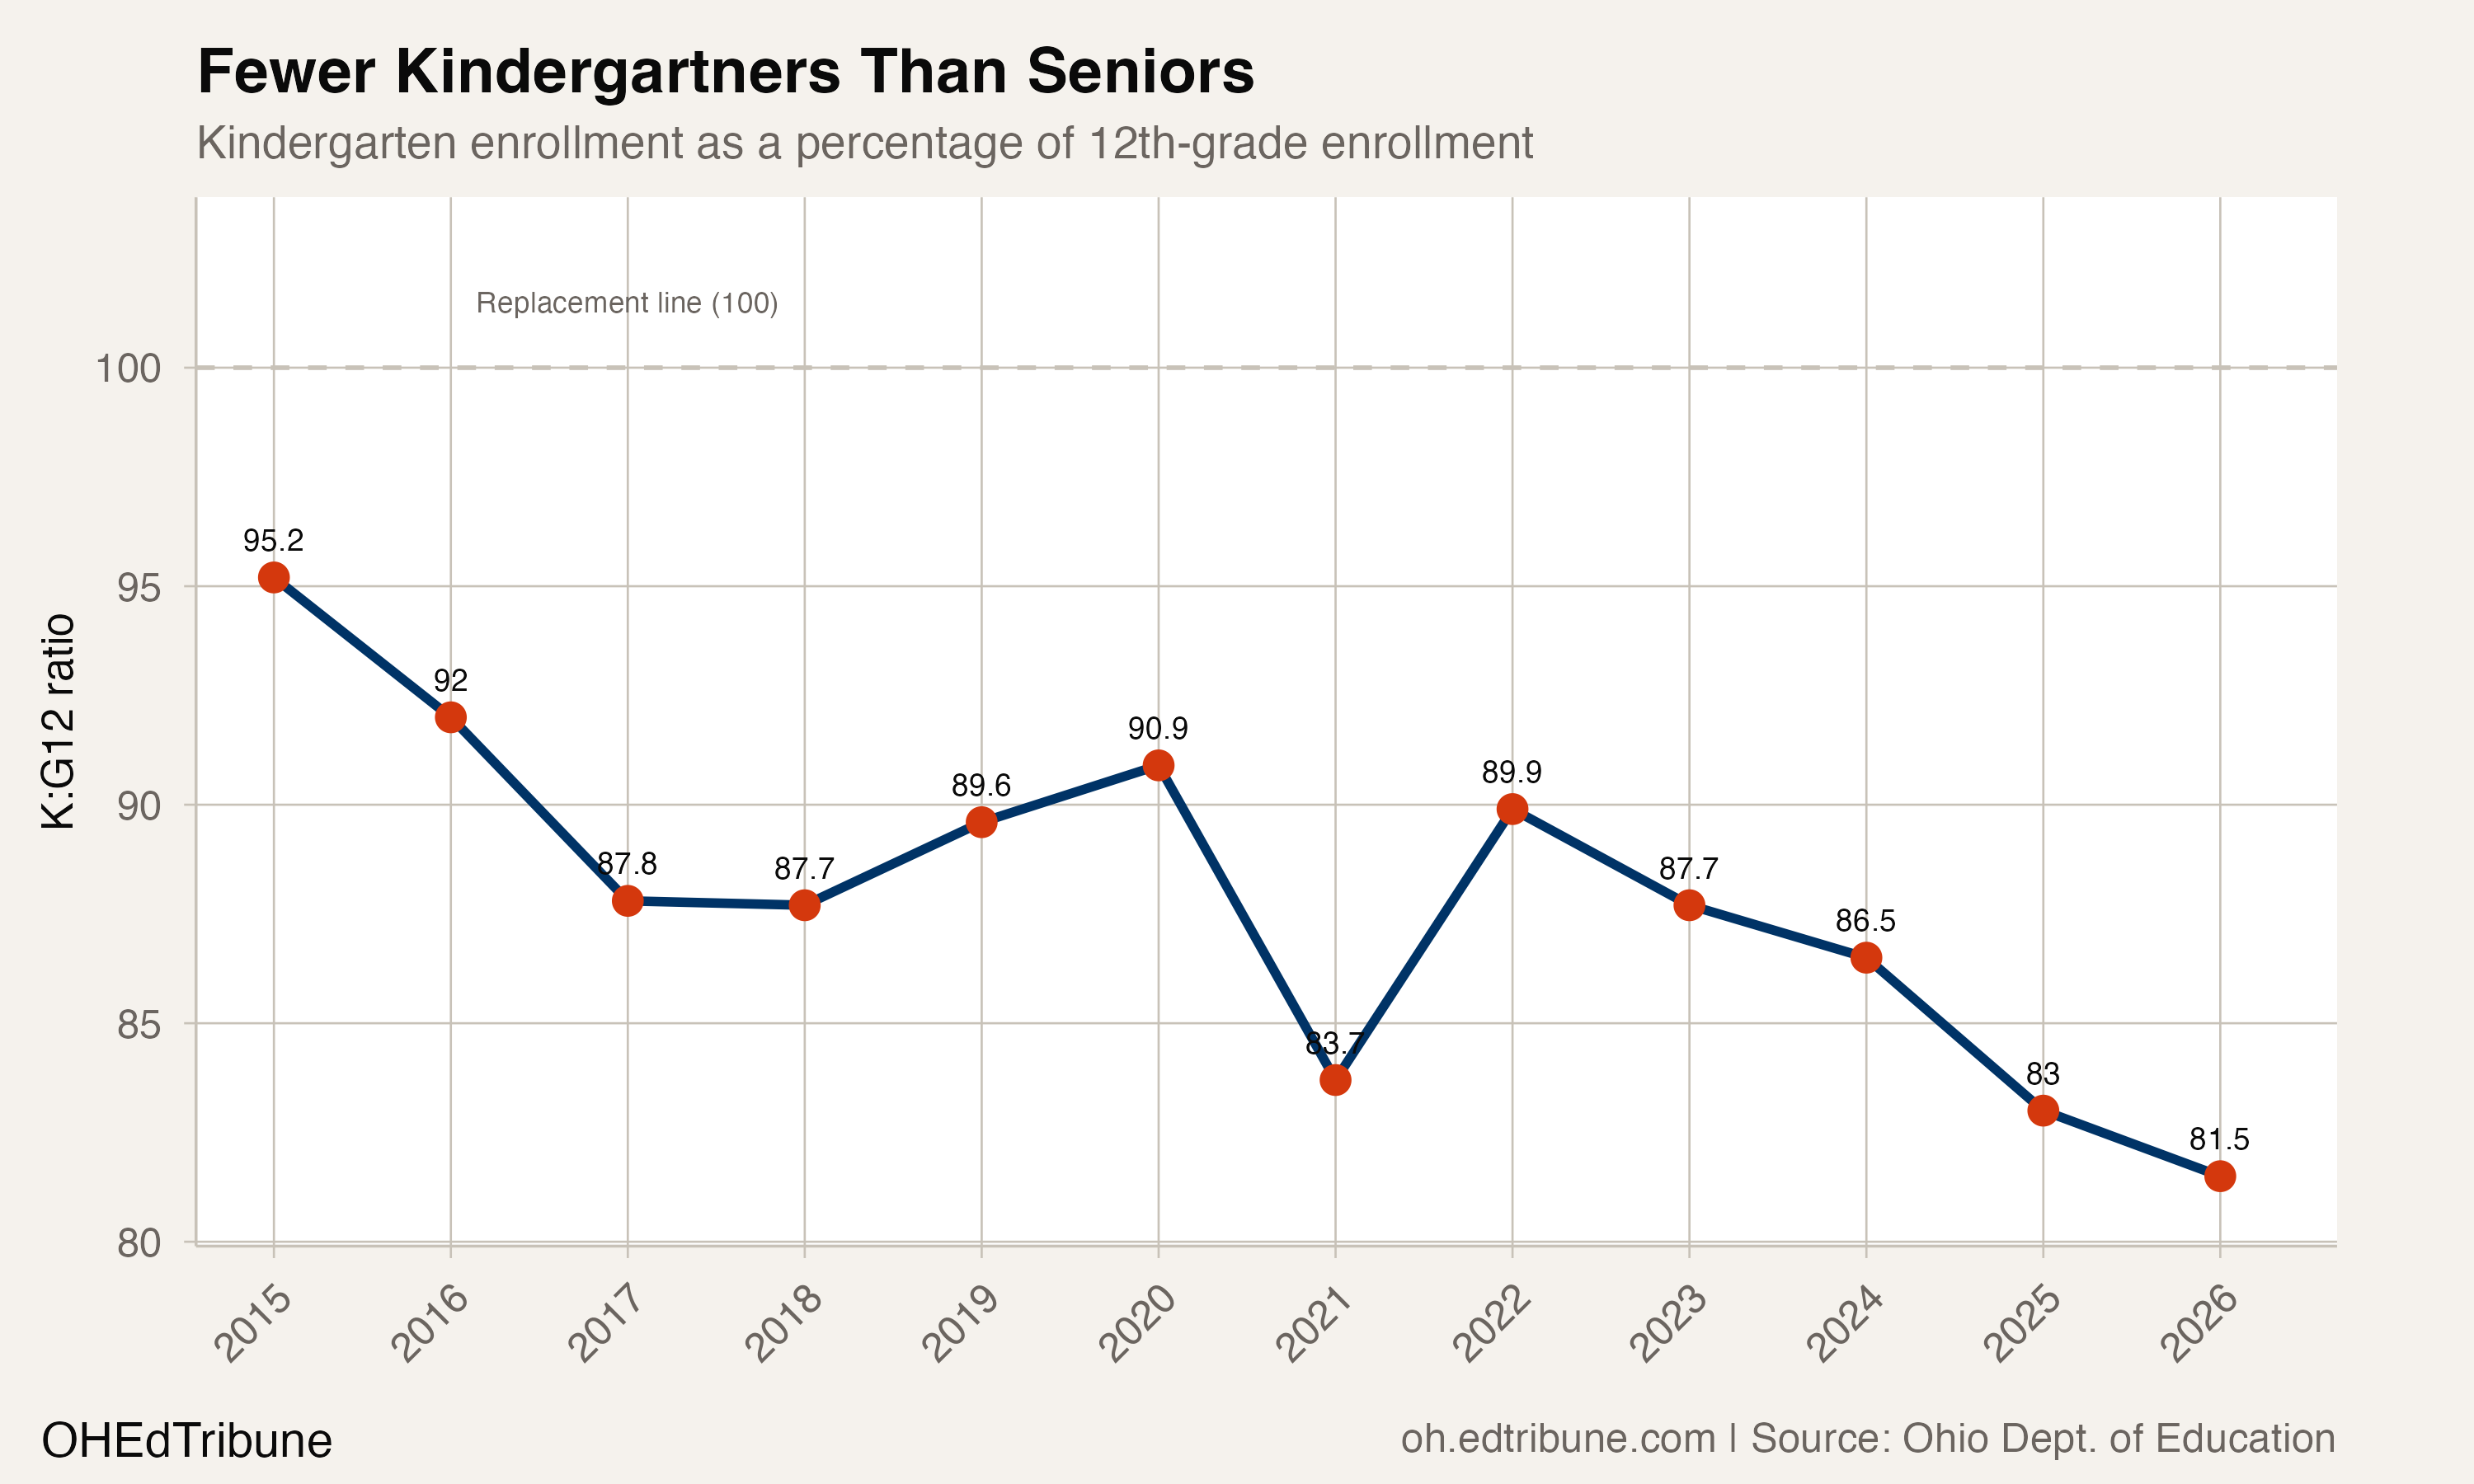
The deepest force is demographic. Ohio's birth rate has been falling for over a decade: CDC data shows births per 1,000 women dropped from 13.5 in 2009 to 11.4 in 2019, a 15.6% decline. Those smaller birth cohorts are now entering kindergarten. Ohio enrolled 129,168 kindergartners in 2014-15; in 2025-26 it enrolled 112,390, a 13.0% decline. For every 100 seniors graduating, only 81.5 kindergartners are entering. The pipeline cannot refill itself.
The second force is school choice. Ohio's universal EdChoice expansion removed income limits in 2023, and more than 60,000 new scholarships were awarded in the first year. Private school enrollment itself barely moved, however. Many new voucher recipients were already attending private schools before the expansion. As one superintendent told the Statehouse News Bureau, "There hasn't been a shift in enrollment. We're not losing students to the private schools." The vouchers subsidized existing choices more than they created new exits from public schools.
The third force is the broader ecosystem of alternatives. Private schools added 18,327 students and charter schools added 4,941 between 2020-21 and 2024-25, according to state data reported by the Dayton Daily News. Homeschooling has also grown, surpassing pandemic-era levels. Combined, these departures are real but modest relative to the demographic undertow pulling the total downward.
Aaron Churchill, research fellow at the Fordham Institute, framed the primary driver as structural rather than behavioral:
"All the demographic factors with reduced childbirth rates, sort of a stagnant general population in Ohio just means there are fewer kids to educate." — Dayton Daily News
Traditional districts absorb the hit
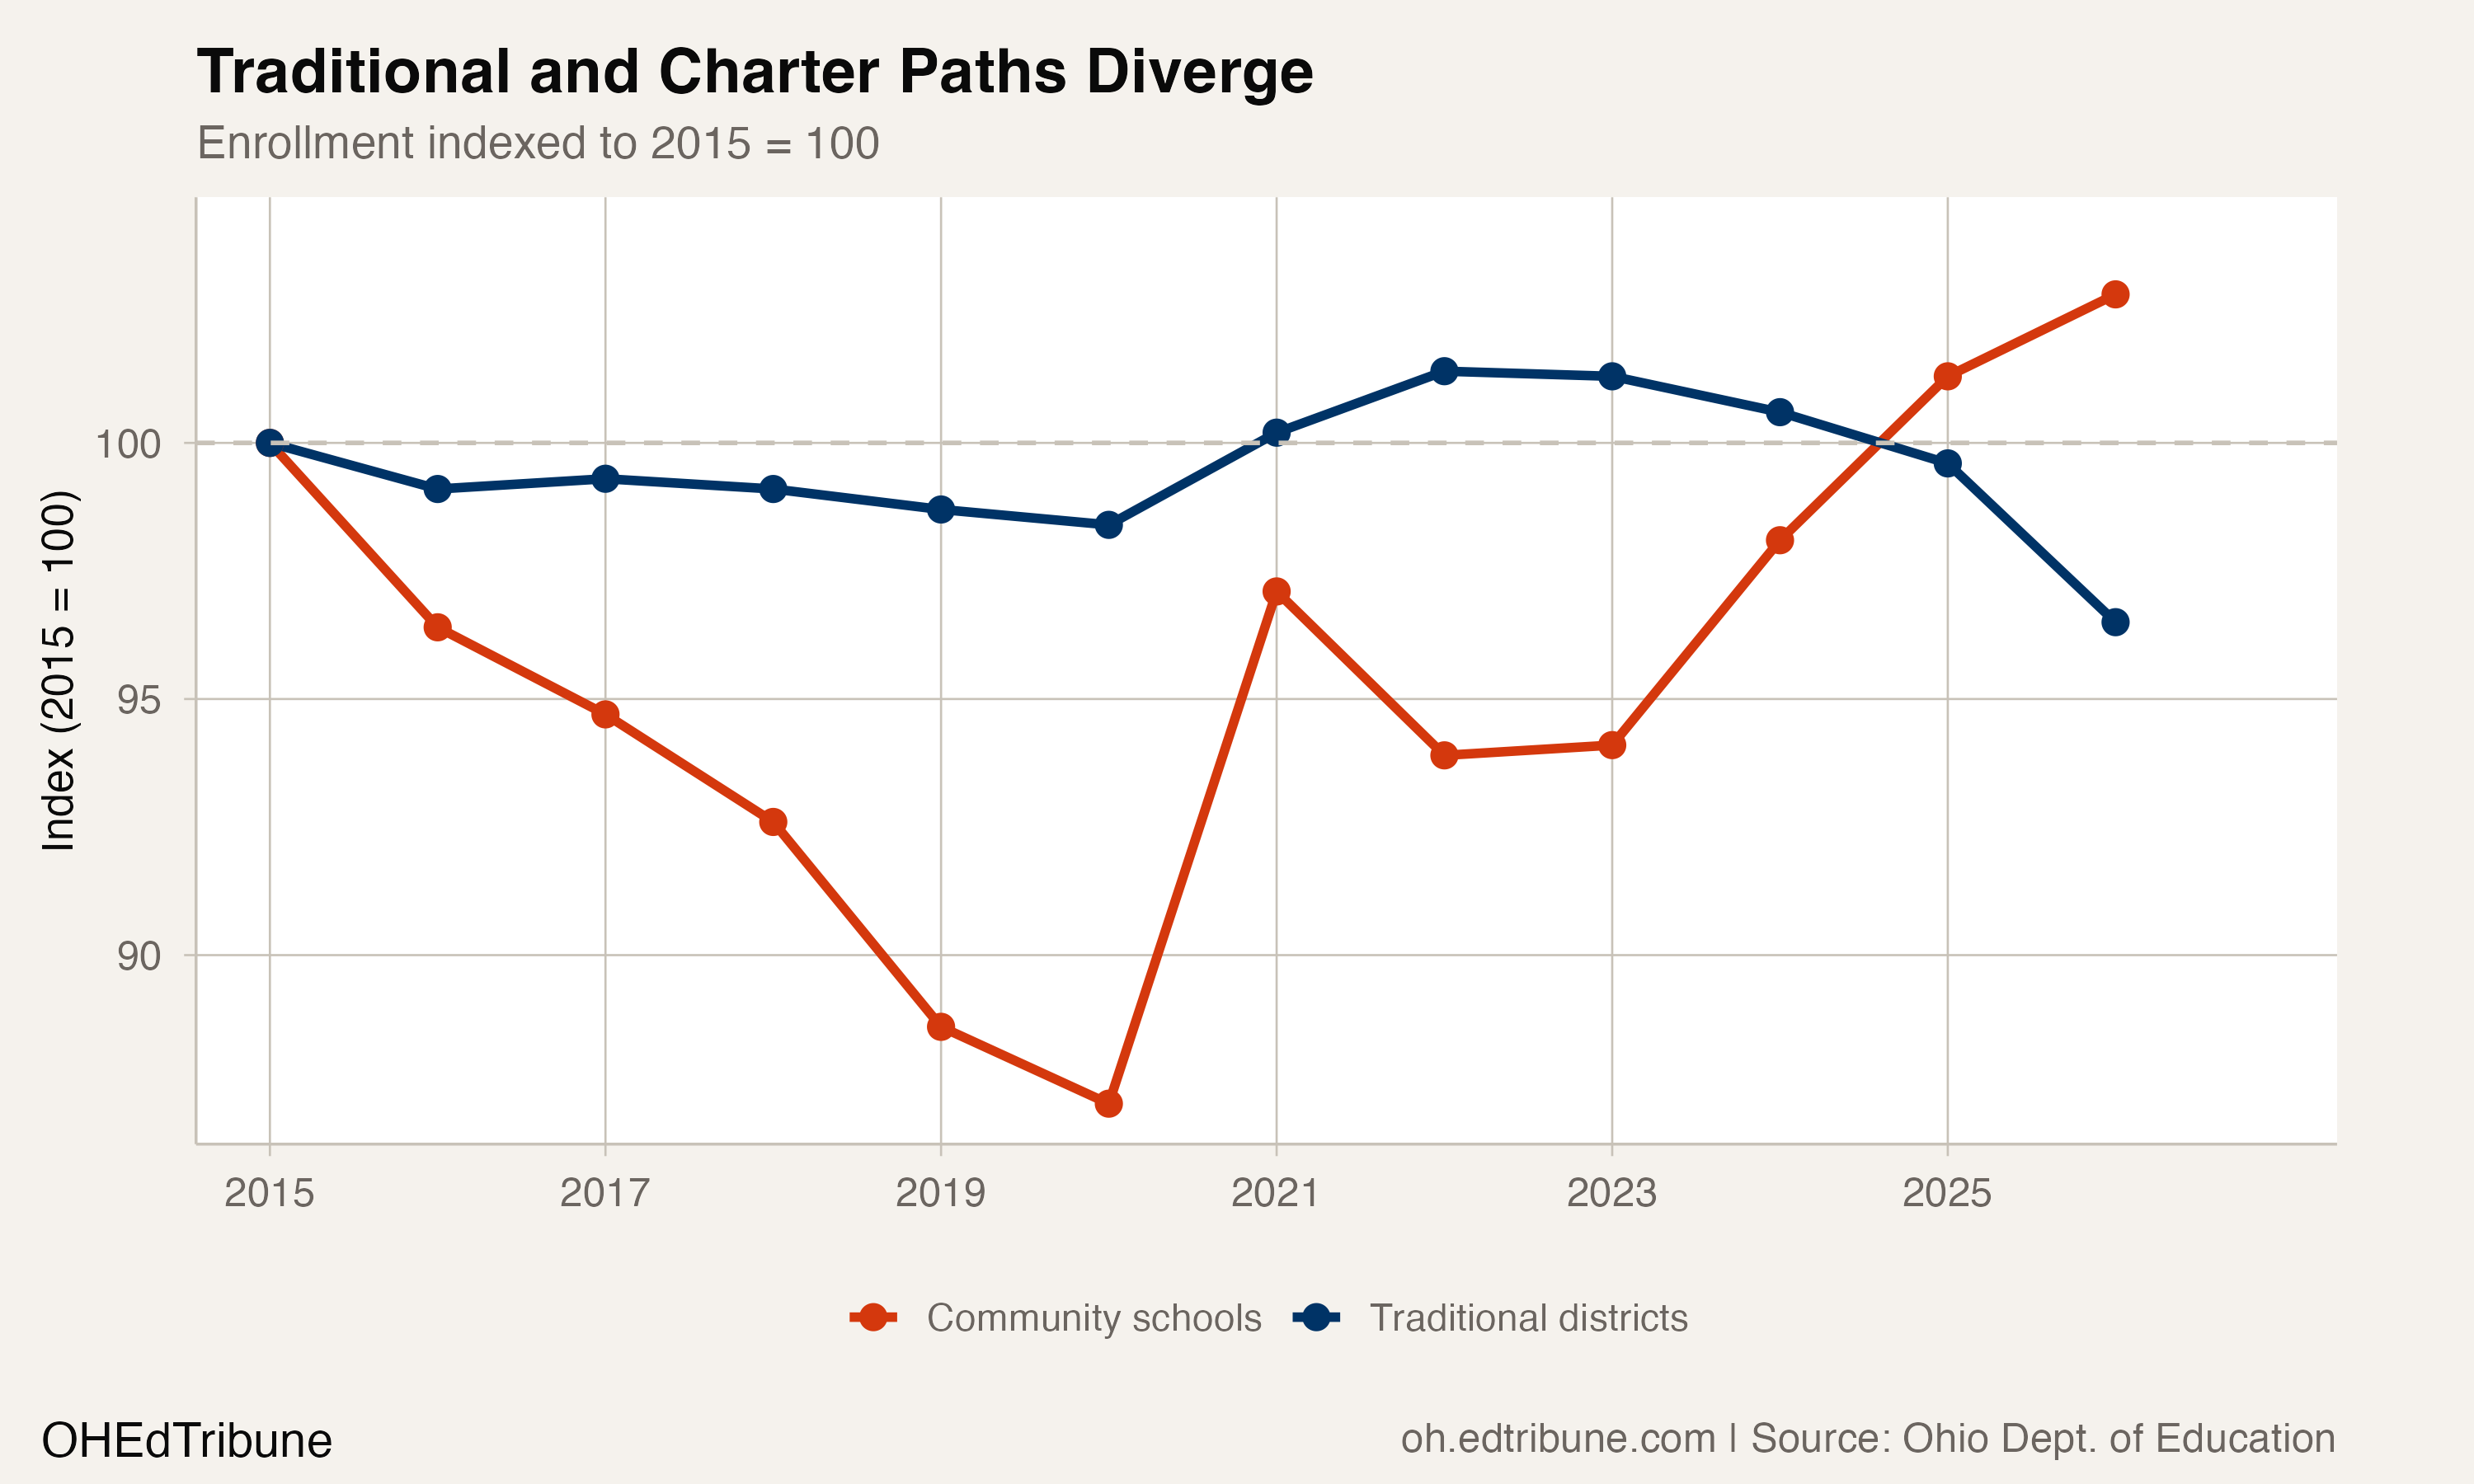
Ohio's community schools, the state's term for charter schools, tell a different story. While traditional districts have shed 159,959 students since 2014-15, community schools have added 3,541 over the same period. Their share of total district-level enrollment has grown modestly, from 7.1% to 7.5%.
The divergence sharpened after COVID. Traditional districts gained during the pandemic rebound in 2021-22 but have since lost 78,171 students across four years. Community schools lost enrollment through 2020, then surged, gaining 19,321 students since their 2020 low. The sectors are now moving in opposite directions.
The net effect is that traditional public schools are absorbing nearly all of the state's enrollment contraction, while community schools grow at their margins. This pattern predates the EdChoice expansion and is consistent with a gradual shift in family enrollment behavior rather than a single policy shock.
The composition beneath the total
The students entering Ohio's schools look substantially different from the students leaving them. White enrollment has fallen by 202,924 students since 2014-15, dropping from 72.7% of total enrollment to 64.6%. Hispanic enrollment has grown by 59,349 students over the same period, nearly doubling its share from 4.8% to 8.5%. Asian enrollment grew by 18,414 (from 2.0% to 3.2%), and multiracial enrollment grew by 31,493 (from 4.6% to 6.7%). Black enrollment held roughly steady, adding 2,952 students.
The state's total enrollment is falling, but its diversity is rising. The districts absorbing the steepest losses are disproportionately those with legacy white enrollment bases. The districts with growing or stable enrollment tend to have higher shares of Hispanic and multiracial students.
What 81 kindergartners per 100 seniors means
The K-to-12th-grade ratio is the clearest leading indicator of what comes next. At 81.5, Ohio has fewer than 82 kindergartners for every 100 seniors. That ratio was 95.2 in 2014-15. Each graduating class that exits will be replaced by a smaller entering class, and the gap is widening.
Ohio enrolled 16,778 fewer kindergartners in 2025-26 than in 2014-15. Meanwhile, 12th-grade enrollment grew by 2,188 students over the same period. The pipeline is narrowing from the bottom. Even if no student left Ohio's public schools for private, charter, or home instruction, enrollment would still fall for years as these smaller cohorts move through the system.
National projections suggest traditional public school enrollment could drop roughly 6% by 2030. Ohio, with its stagnant population and accelerating losses, may exceed that pace. Cincinnati is staring at a $50 million budget gap. Cleveland just voted to close 29 buildings. And the kindergarten classes entering behind them are the smallest Ohio has produced in a generation.
Detailed code that reproduces the analysis and figures in this article is available exclusively to EdTribune subscribers.
Discussion
Sign in to join the discussion.
Loading comments...