Forty-five of Ohio's 49 Joint Vocational School Districts grew between 2021 and 2026. Only one shrank. In a state where traditional public school enrollment fell by 77,854 students over the same period, career-tech centers added 20,389, a 23.1% surge that pushed total JVSD enrollment to an all-time high of 108,583.
The numbers are stark enough to raise a structural question: Ohio's education system is contracting, but one sector is expanding fast enough to have waitlists stretching into the hundreds. That mismatch is reshaping where students go, what they study, and who gets access.
The sector everyone else wants to be
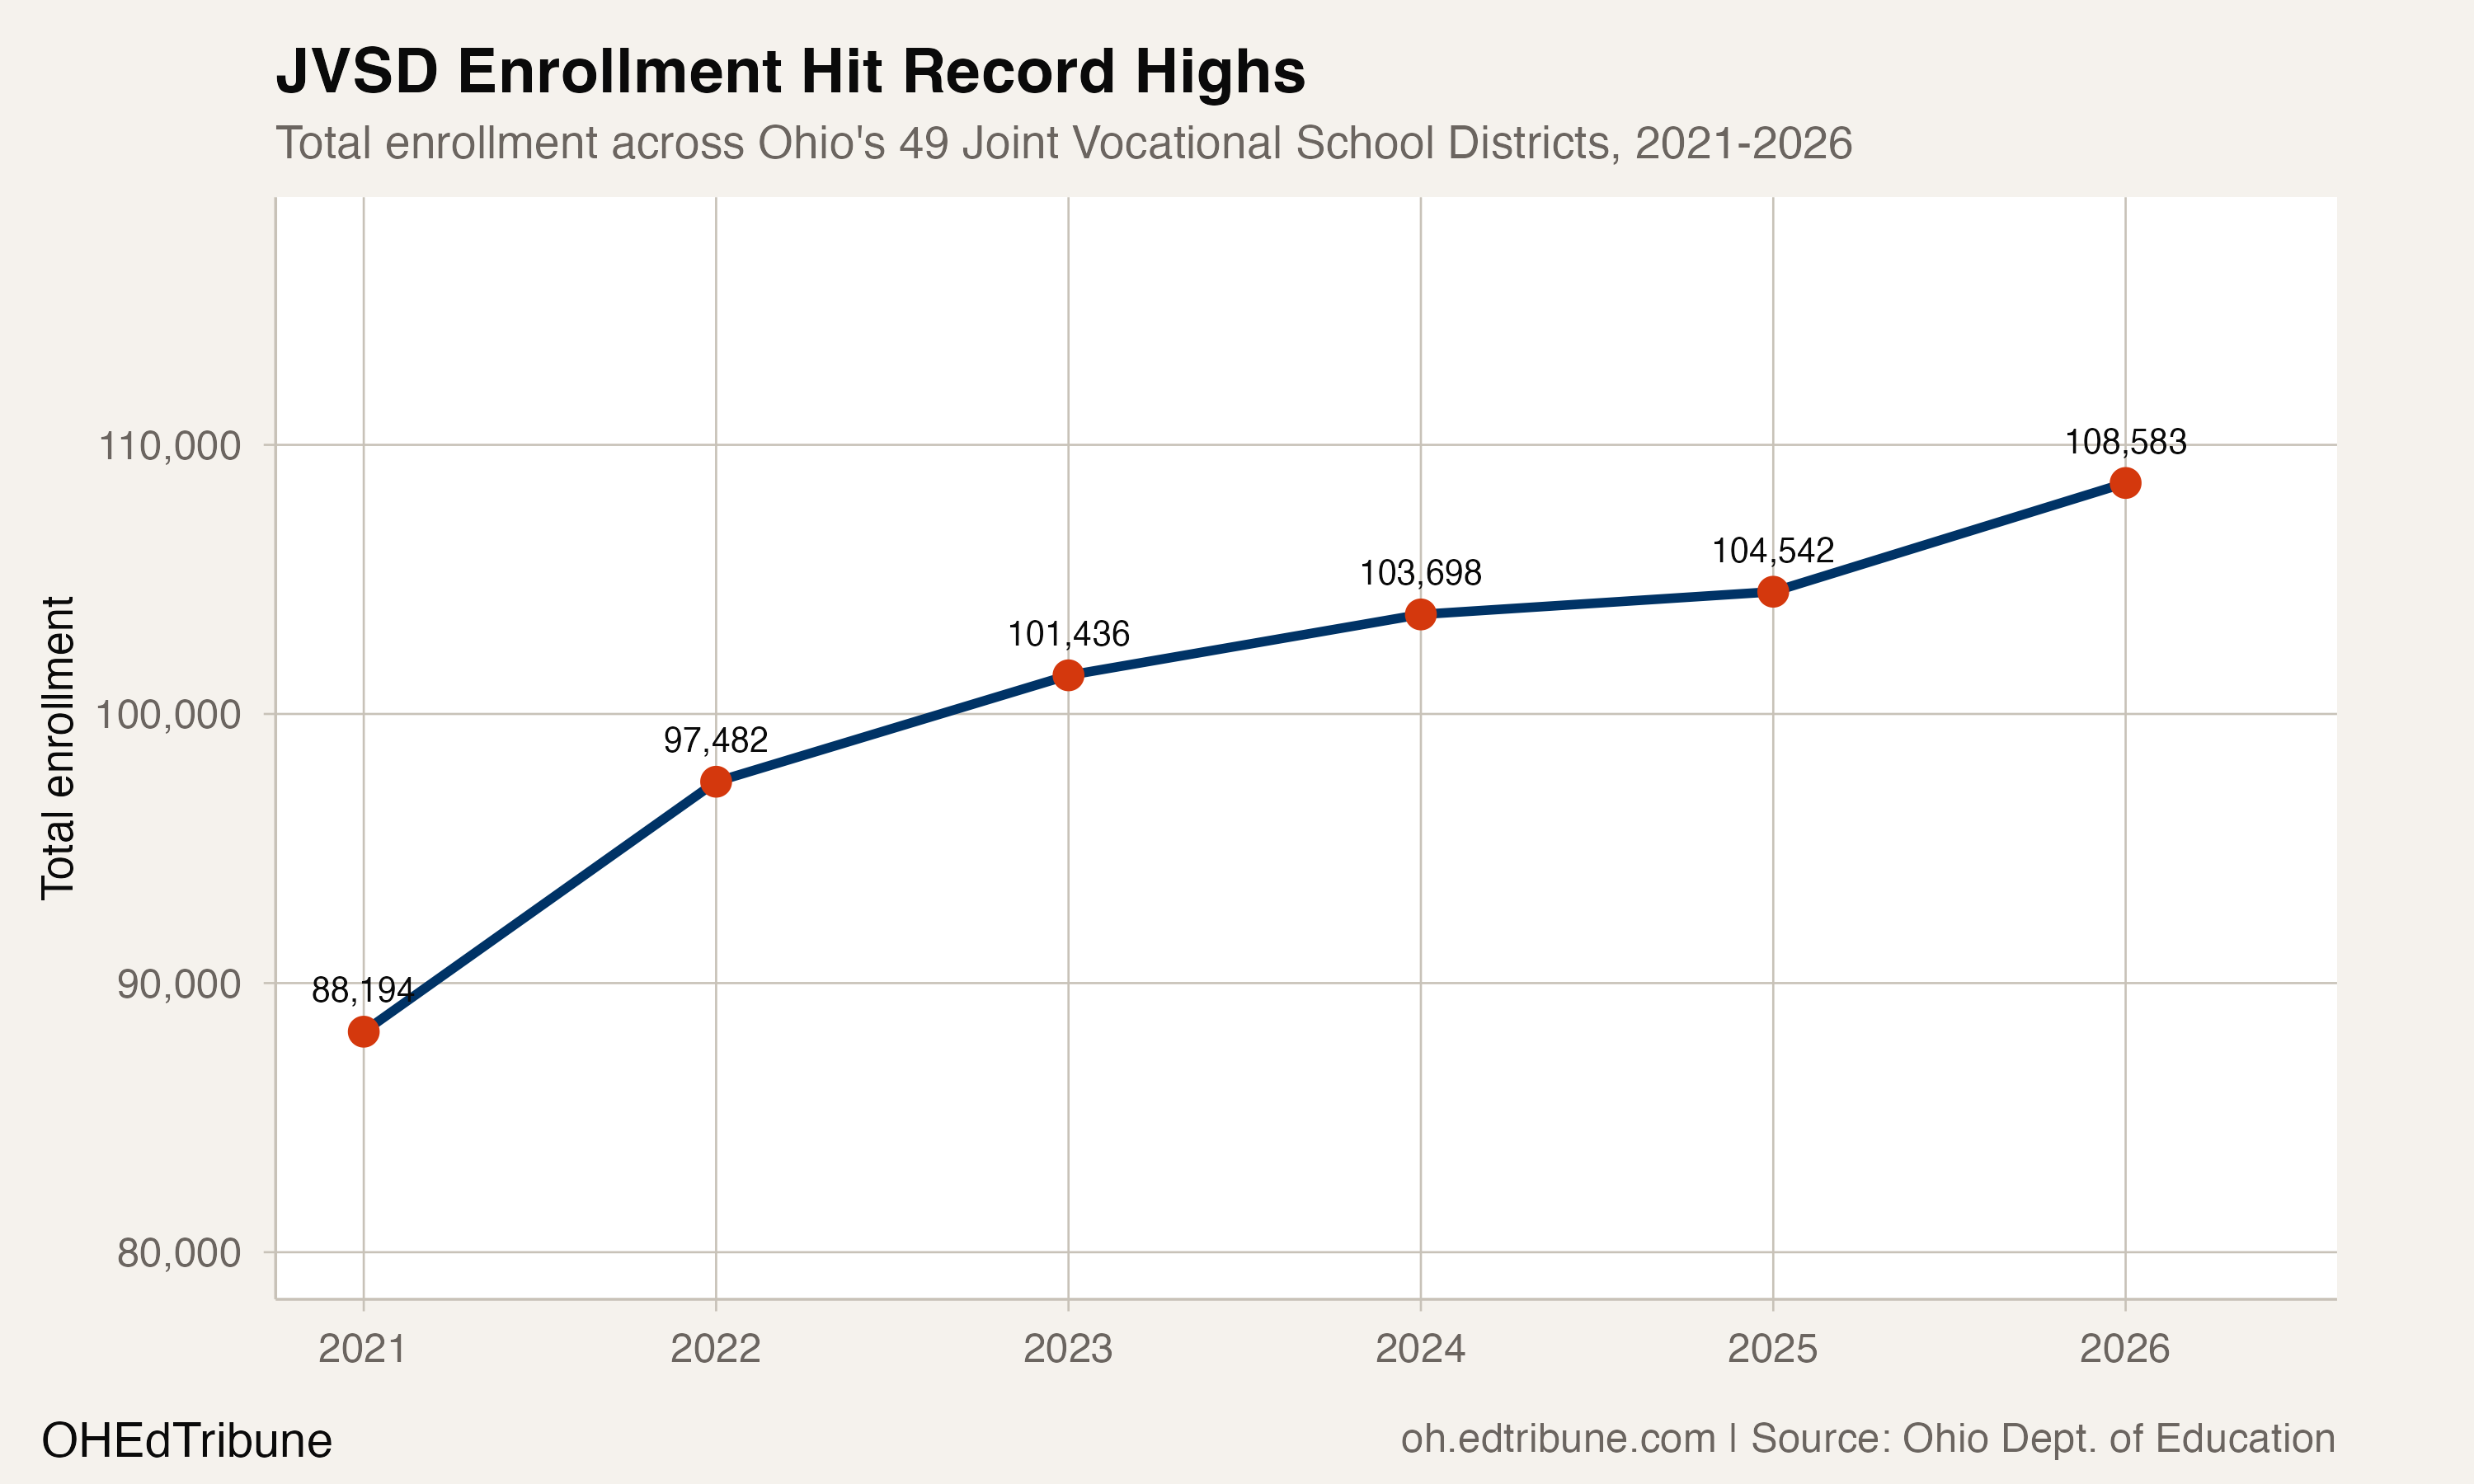
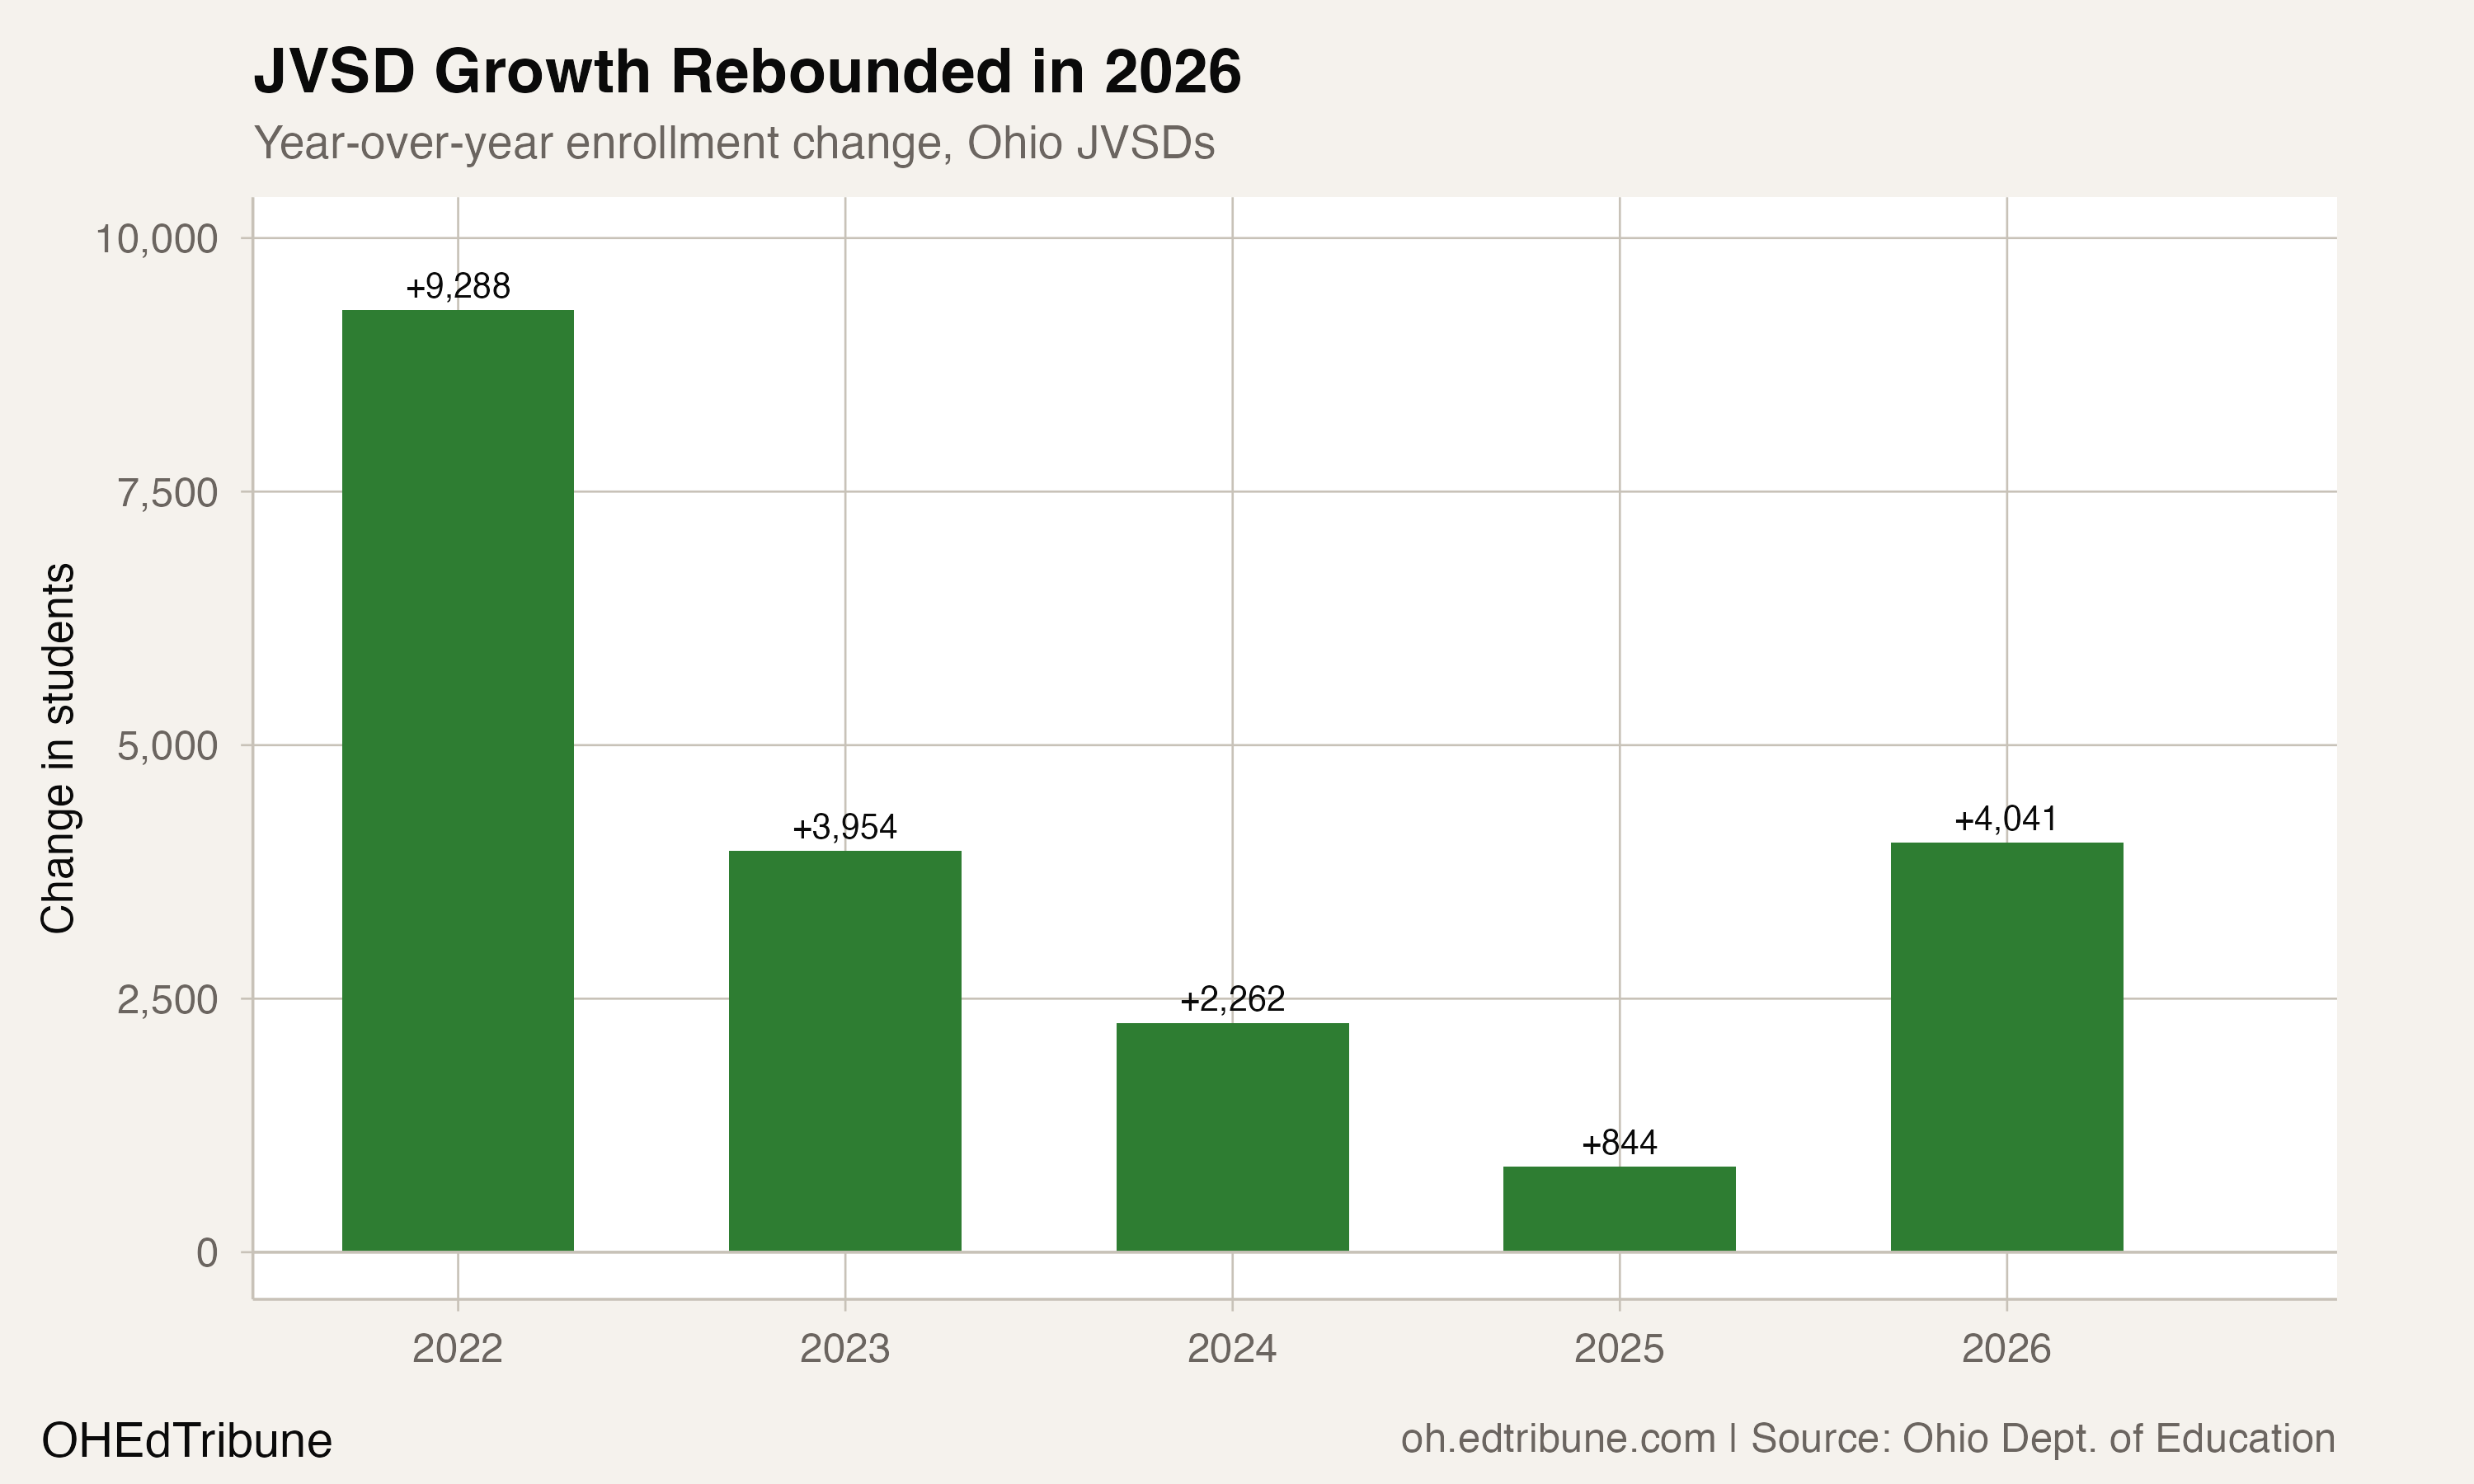
JVSD enrollment climbed every year from 2021 to 2026, from 88,194 to 108,583. The initial surge was largest: 9,288 new students in 2022 alone, a 10.5% single-year jump. Growth decelerated through 2025, when JVSDs added just 844 students, before rebounding to 4,041 in 2026.
The trajectory stands in isolation. Traditional districts, which serve the vast majority of Ohio students, lost 5.1% of their enrollment over the same window. Community schools (Ohio's term for charter schools) grew modestly, by 5.9%. JVSDs outpaced both by a wide margin.
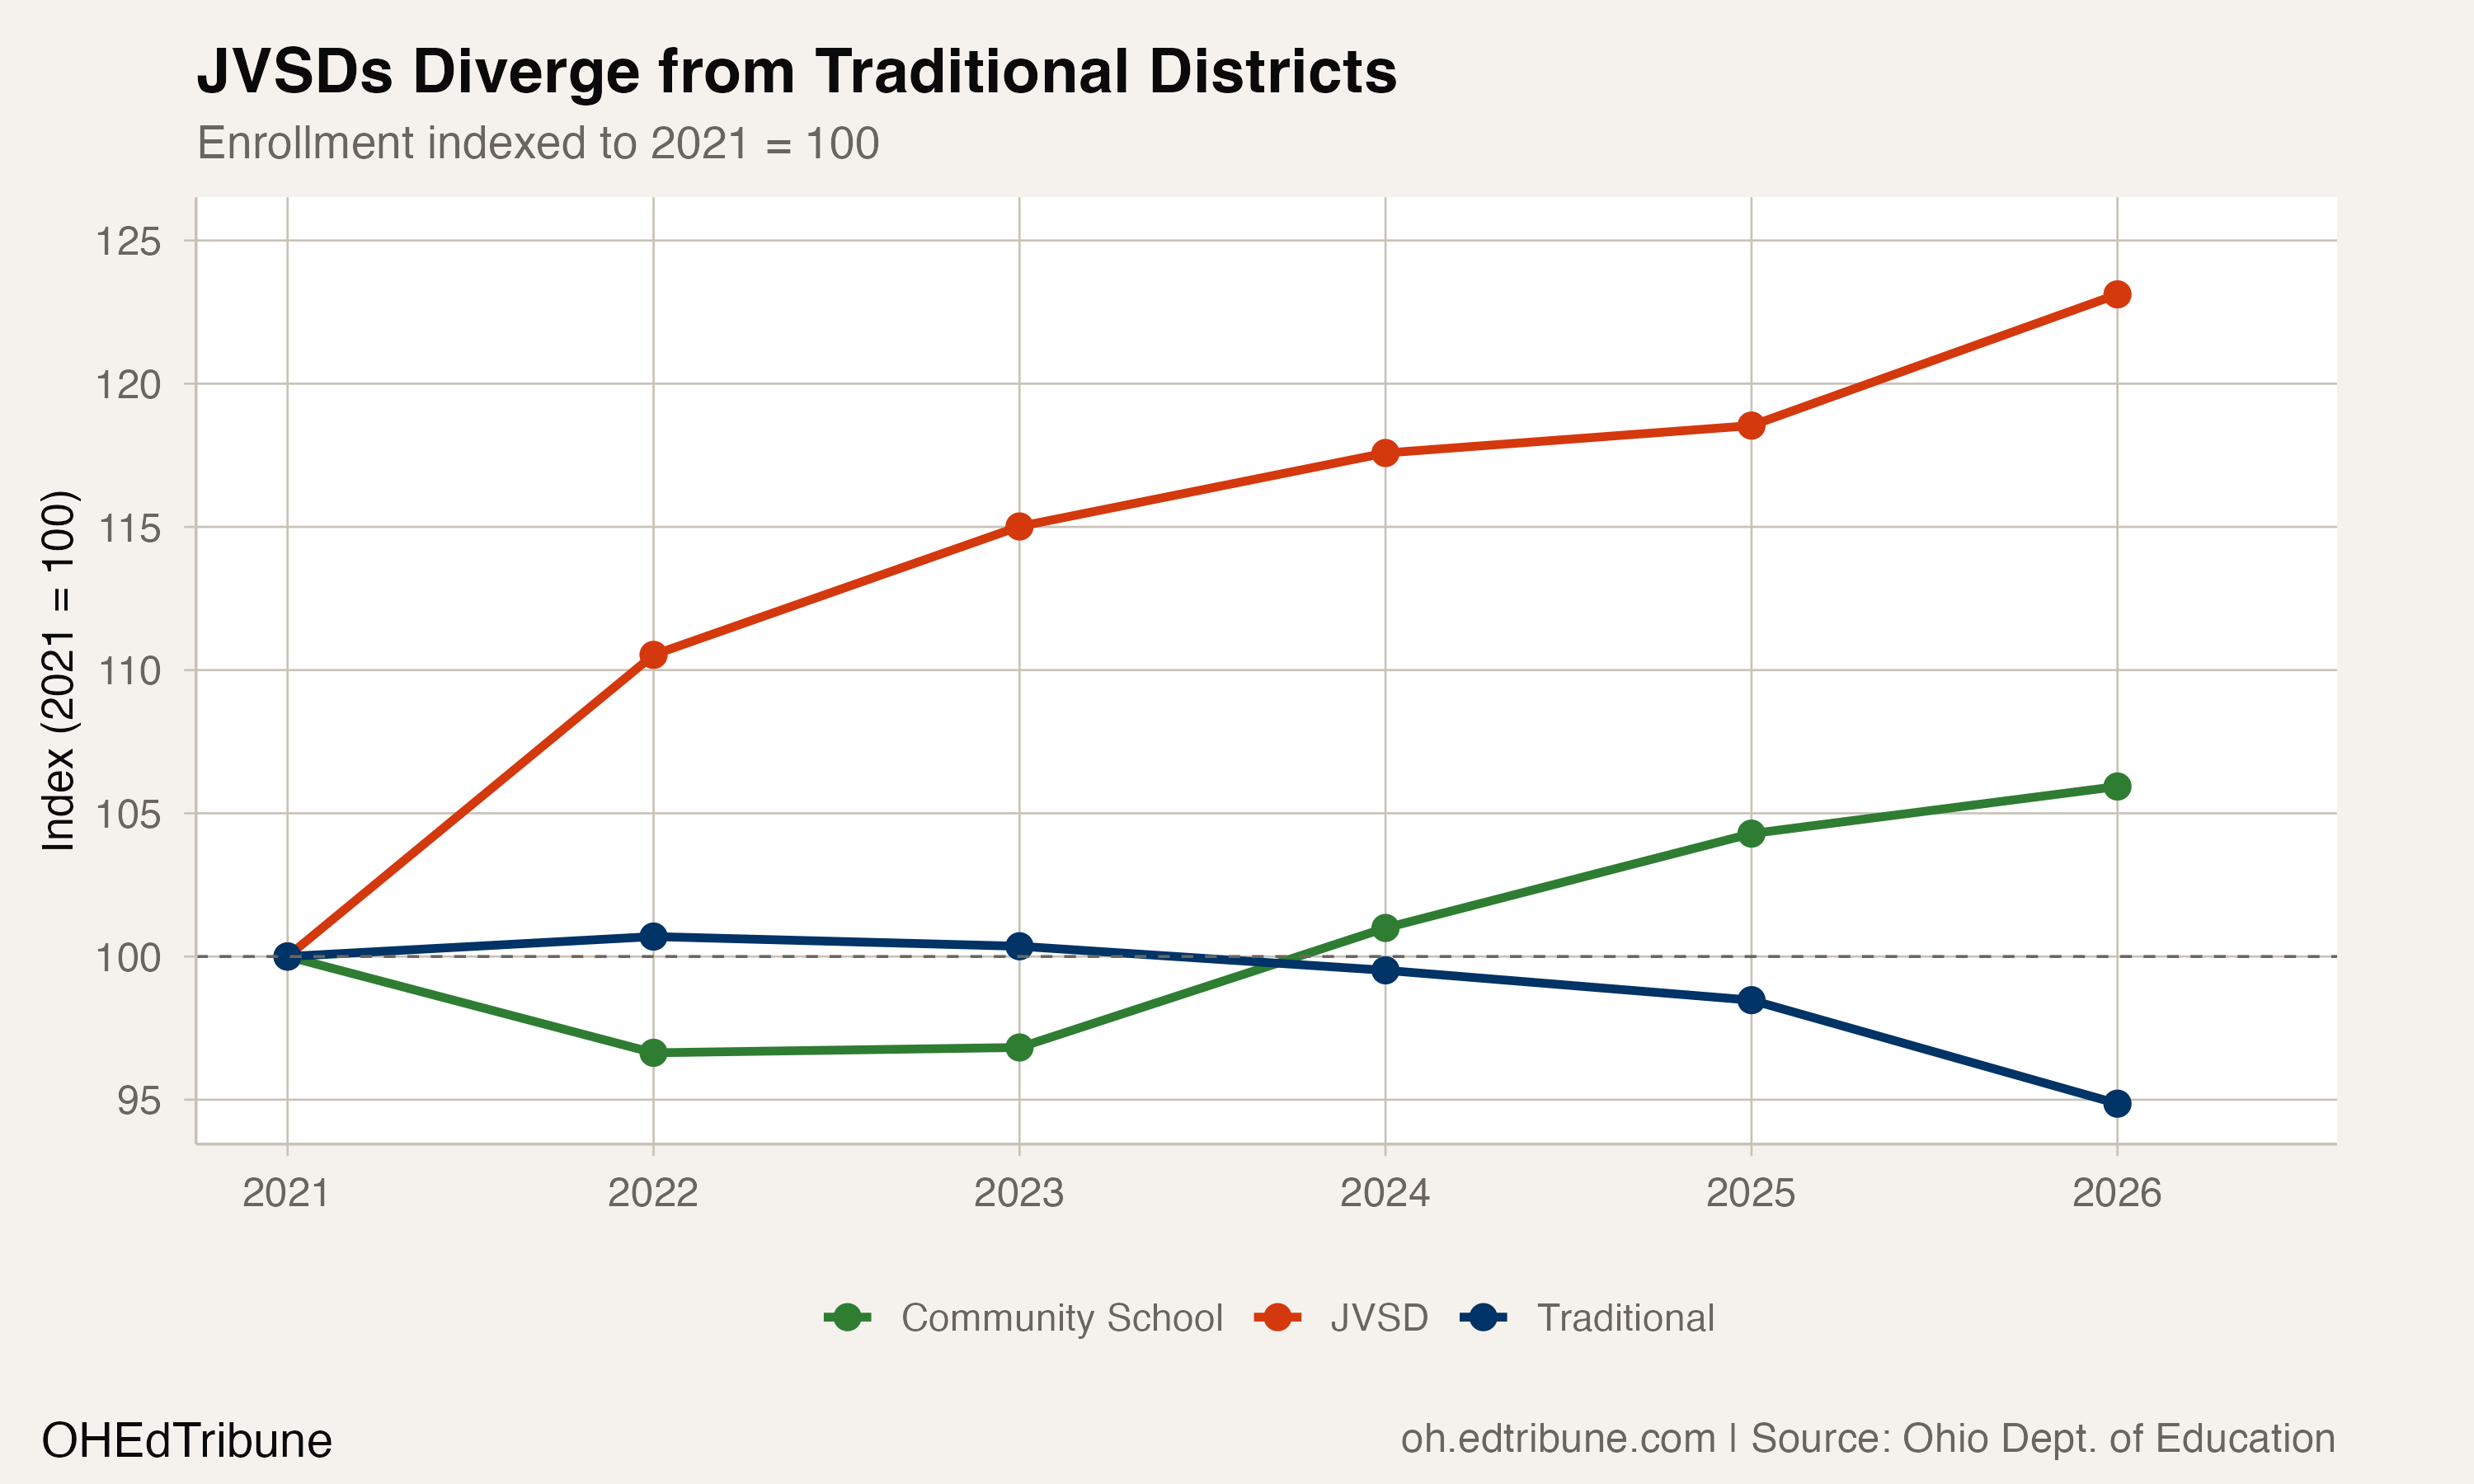
Indexed to 2021, JVSD enrollment reached 123 by 2026 while traditional districts dropped to 95. The gap widened every year.
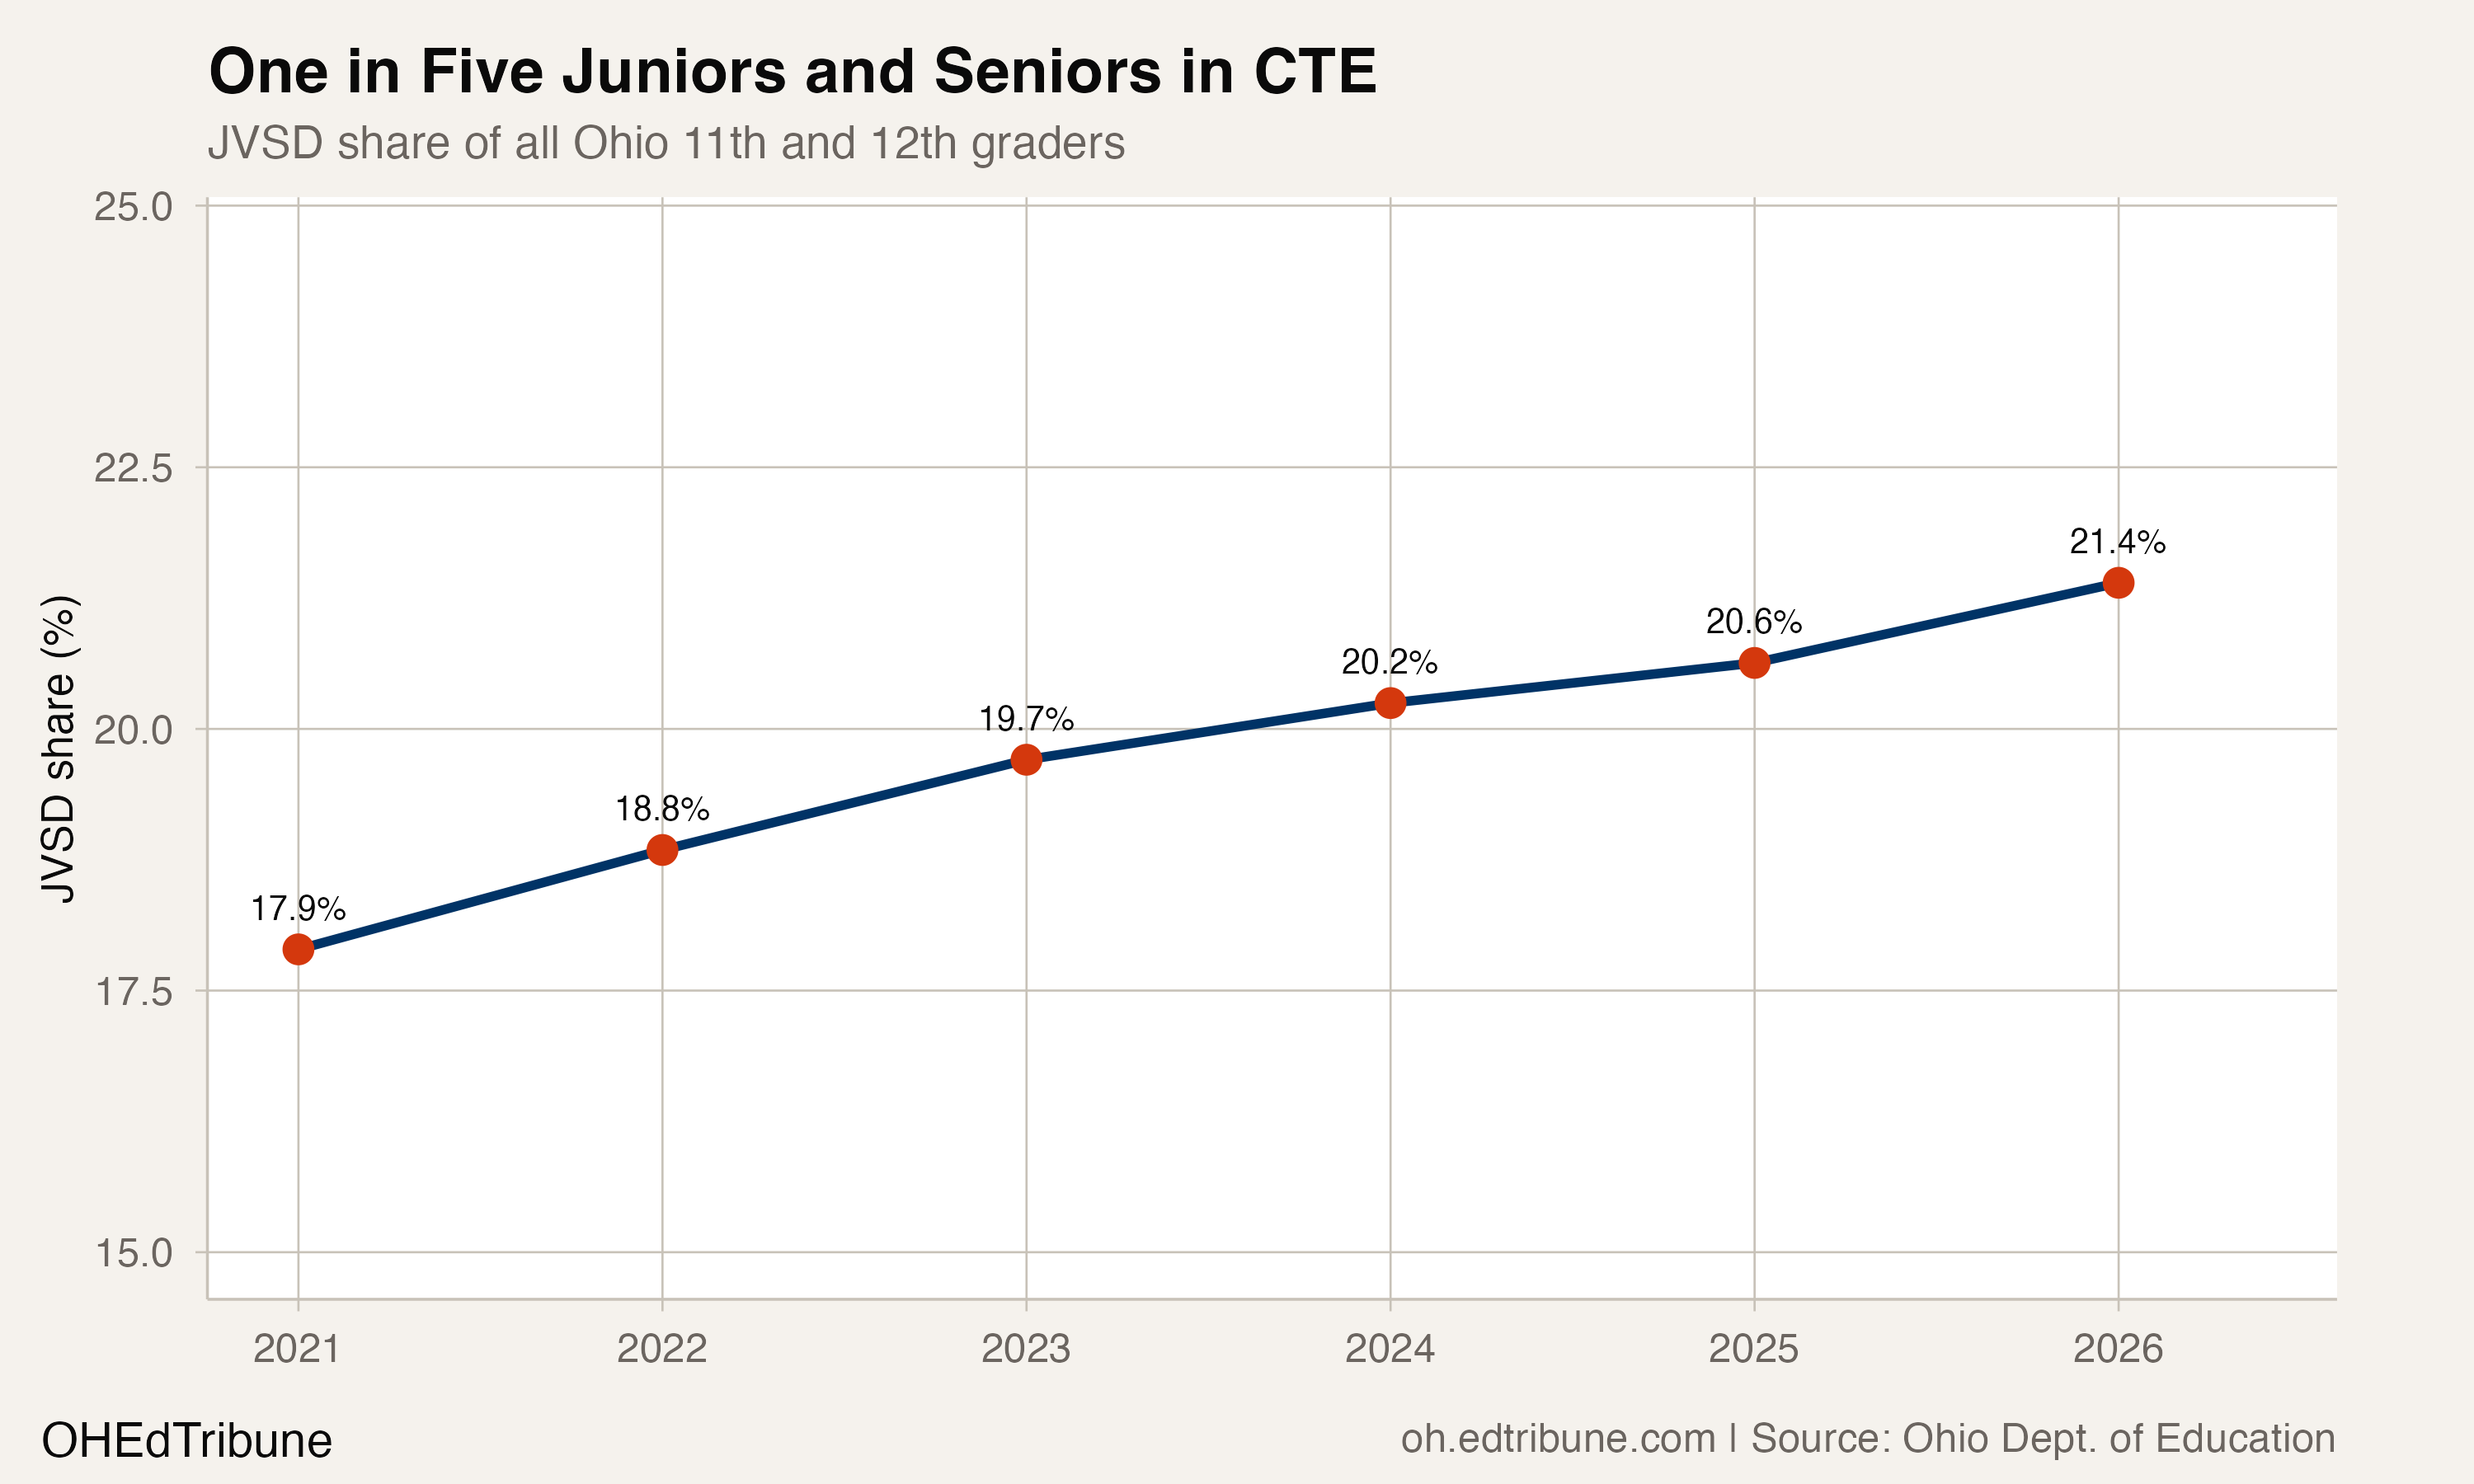
The consequence is measurable in a single statistic: 21.4% of all Ohio 11th and 12th graders now attend a JVSD, up from 17.9% in 2021. For juniors and seniors, career-tech is no longer a niche pathway. It is the destination for more than one in five.
Where the growth concentrated
The boom was broad. Of 49 JVSDs with data in both 2021 and 2026, 45 grew. Thirty-two hit all-time enrollment highs in 2026.
Butler Technology & Career Development Schools↗ET, the state's largest career-tech center at 13,167 students across seven campuses, held relatively steady. The fastest growth came from mid-sized centers expanding rapidly.
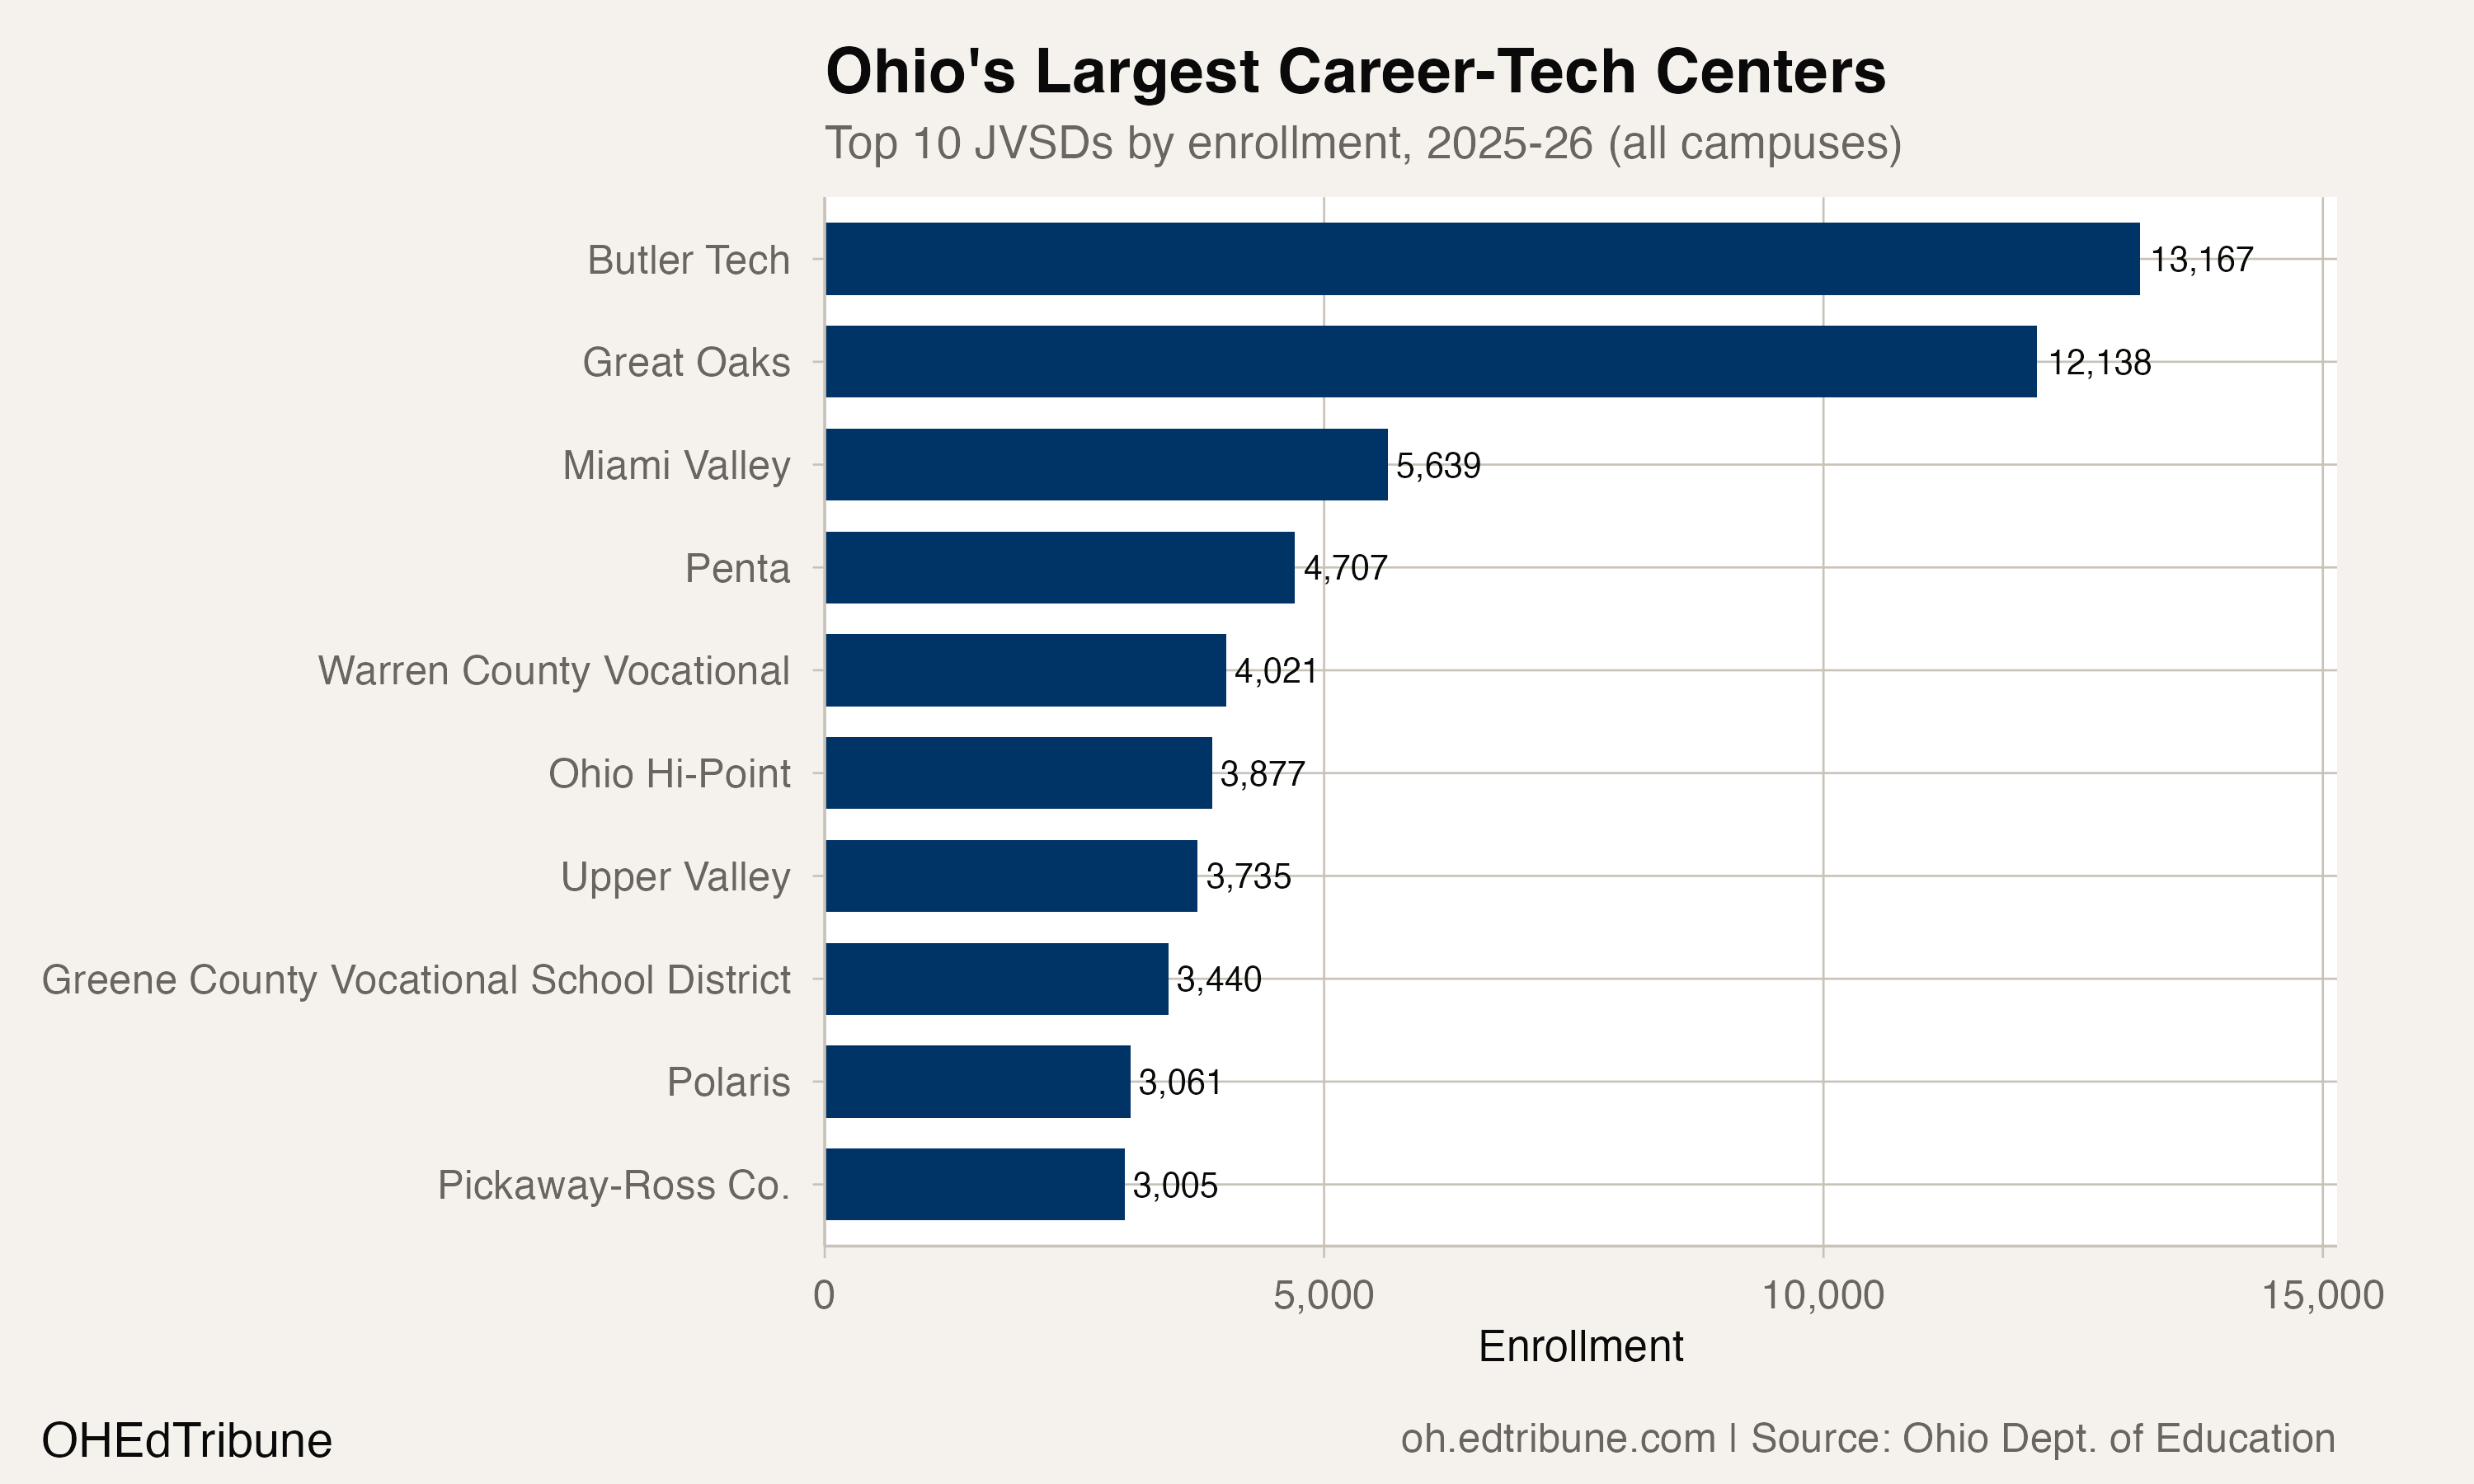
Miami Valley Career Tech↗ET led in absolute gains, adding 1,945 students (+52.7%) to reach 5,639. Greene County Vocational School District↗ET nearly doubled, from 1,917 to 3,440 (+79.4%). Eastland-Fairfield Career & Technical Schools↗ET grew 63.6%, from 1,782 to 2,915.
The only JVSD to lose enrollment was Mahoning County Career & Technical Center in the Youngstown metro, which dropped from 810 to 741 students, a decline of 8.5% that mirrors the broader population loss in northeastern Ohio's Mahoning Valley.
Waitlists and the $300 million bet
The growth has outstripped capacity. Miami Valley Career Tech Center expanded from roughly 1,600 to 2,250 seats after a $158 million renovation, then blew past the new cap. Its superintendent, Nick Weldy, told the Journal-News that the center's waitlist had swelled to 534 students. Greene County's $70 million facility, built for 950, is now serving close to 1,100. Upper Valley Career Center is spending $18 million to expand.
The state saw this coming. In the FY 2024-2025 budget, Ohio lawmakers allocated $300 million for CTE facility expansion and equipment, the largest single investment in career-tech infrastructure in state history. Governor DeWine framed the need plainly in his 2023 State of the State address:
"So often, the teachers would tell us that more kids want to take [career technical] courses, but there are waitlists because there simply aren't enough open spots." -- The Statehouse News Bureau, May 2025
The funding went primarily to JVSDs for new buildings, equipment, and expanded program capacity. The per-pupil CTE base cost also rose from $8,891 in FY 2022-2023 to $9,856 in FY 2024-2025, a $965-per-student increase.
Aaron Churchill of the Thomas B. Fordham Institute, which has published multiple analyses of Ohio's CTE landscape, put the trend in context:
"There are more students that are participating in career technical courses at Joint Vocational School Districts than we've basically ever seen on record." -- The Statehouse News Bureau, May 2025
The demand signal underneath
The most likely driver of the JVSD boom is employer demand for skilled trades workers, amplified by state policy. Ohio's manufacturing sector faces an aging workforce. Welding, machining, robotics, and health care programs are at or over capacity. Pickaway-Ross Career and Technology Center's welding class alone carries a waitlist of more than 70 students.
A competing explanation is structural: JVSD enrollment growth may partly reflect changes in reporting or program classification rather than more students choosing career-tech. The number of JVSD rows in state data grew from 64 campuses in 2021 to 67 in 2026, as centers like Butler Tech opened new satellite facilities (an aviation hangar, an advanced manufacturing hub). Some of the enrollment gain reflects new capacity counting students who previously accessed CTE through their home districts.
Who career-tech serves, and who it does not
The JVSD boom has a demographic pattern worth noting. In 2025-26, JVSD students are 79.7% white. Statewide, white students make up 64.6% of enrollment. Black students are 7.2% of JVSD enrollment versus 16.9% statewide, and Hispanic students are 6.1% versus 8.5%.
The gap is narrowing slowly. White share in JVSDs has dropped from 84.1% in 2021 to 79.7% in 2026, a decline of 4.4 percentage points. But JVSDs remain substantially whiter than the state as a whole, and the gap is especially pronounced for Black students, who are underrepresented by nearly 10 percentage points.
Churchill has pointed to the geographic structure of JVSDs as one driver: career-tech centers are concentrated in suburban and rural areas, while students in urban districts have less access to specialized CTE programs that are more likely to offer credentials in high-demand career fields. Ohio's Department of Education uses 10% or less CTE enrollment as a threshold for identifying districts with an effective access gap.
What JVSDs actually look like from the inside
The grade-level distribution of JVSD enrollment confirms that these are primarily upper-secondary institutions. In 2025-26, 55.9% of JVSD students were in grades 11 and 12. Another 22.9% were in grades 9 and 10. The remaining 20.6% were in grades 6 through 8, a band that has grown as career-tech centers add middle school exploration programs.
Butler Tech illustrates the scale. Its seven campuses span the D. Russel Lee Career-Technology Center (12,205 students), a Bioscience Center (406), a Natural Science Center (181), a School of the Arts (175), and three newer specialty sites. The system has been adding facilities steadily, including a $12.7 million bioscience wing that opened in early 2026 and an advanced manufacturing hub developed in partnership with Miami University.
Great Oaks Career Campuses↗ET, the second-largest system at 12,138 students, operates five campuses across southwestern Ohio and added 1,761 students since 2021.
The tension at the center
Ohio is spending $300 million to expand a sector that is already growing at 23% while the traditional system it draws from is contracting at 5%. Every student who opts into a JVSD is a student whose per-pupil funding follows them out of a traditional district that may already be losing enrollment. For growing suburban districts, this is manageable. For shrinking urban and rural districts, it compounds the pressure.
JVSDs are 79.7% white in a state that is 64.6% white. Black students make up 16.9% of Ohio's enrollment but only 7.2% of career-tech. The state has signaled awareness of this gap and created a $10-per-pupil career awareness fund for all K-12 districts. Meanwhile, Pickaway-Ross has 70 students on a waitlist for welding alone, and Miami Valley Career Tech has 534 families waiting for a seat. The $300 million is buying buildings. The harder investment is making sure the students who need career-tech most can get through the door.
Detailed code that reproduces the analysis and figures in this article is available exclusively to EdTribune subscribers.
Discussion
Sign in to join the discussion.
Loading comments...