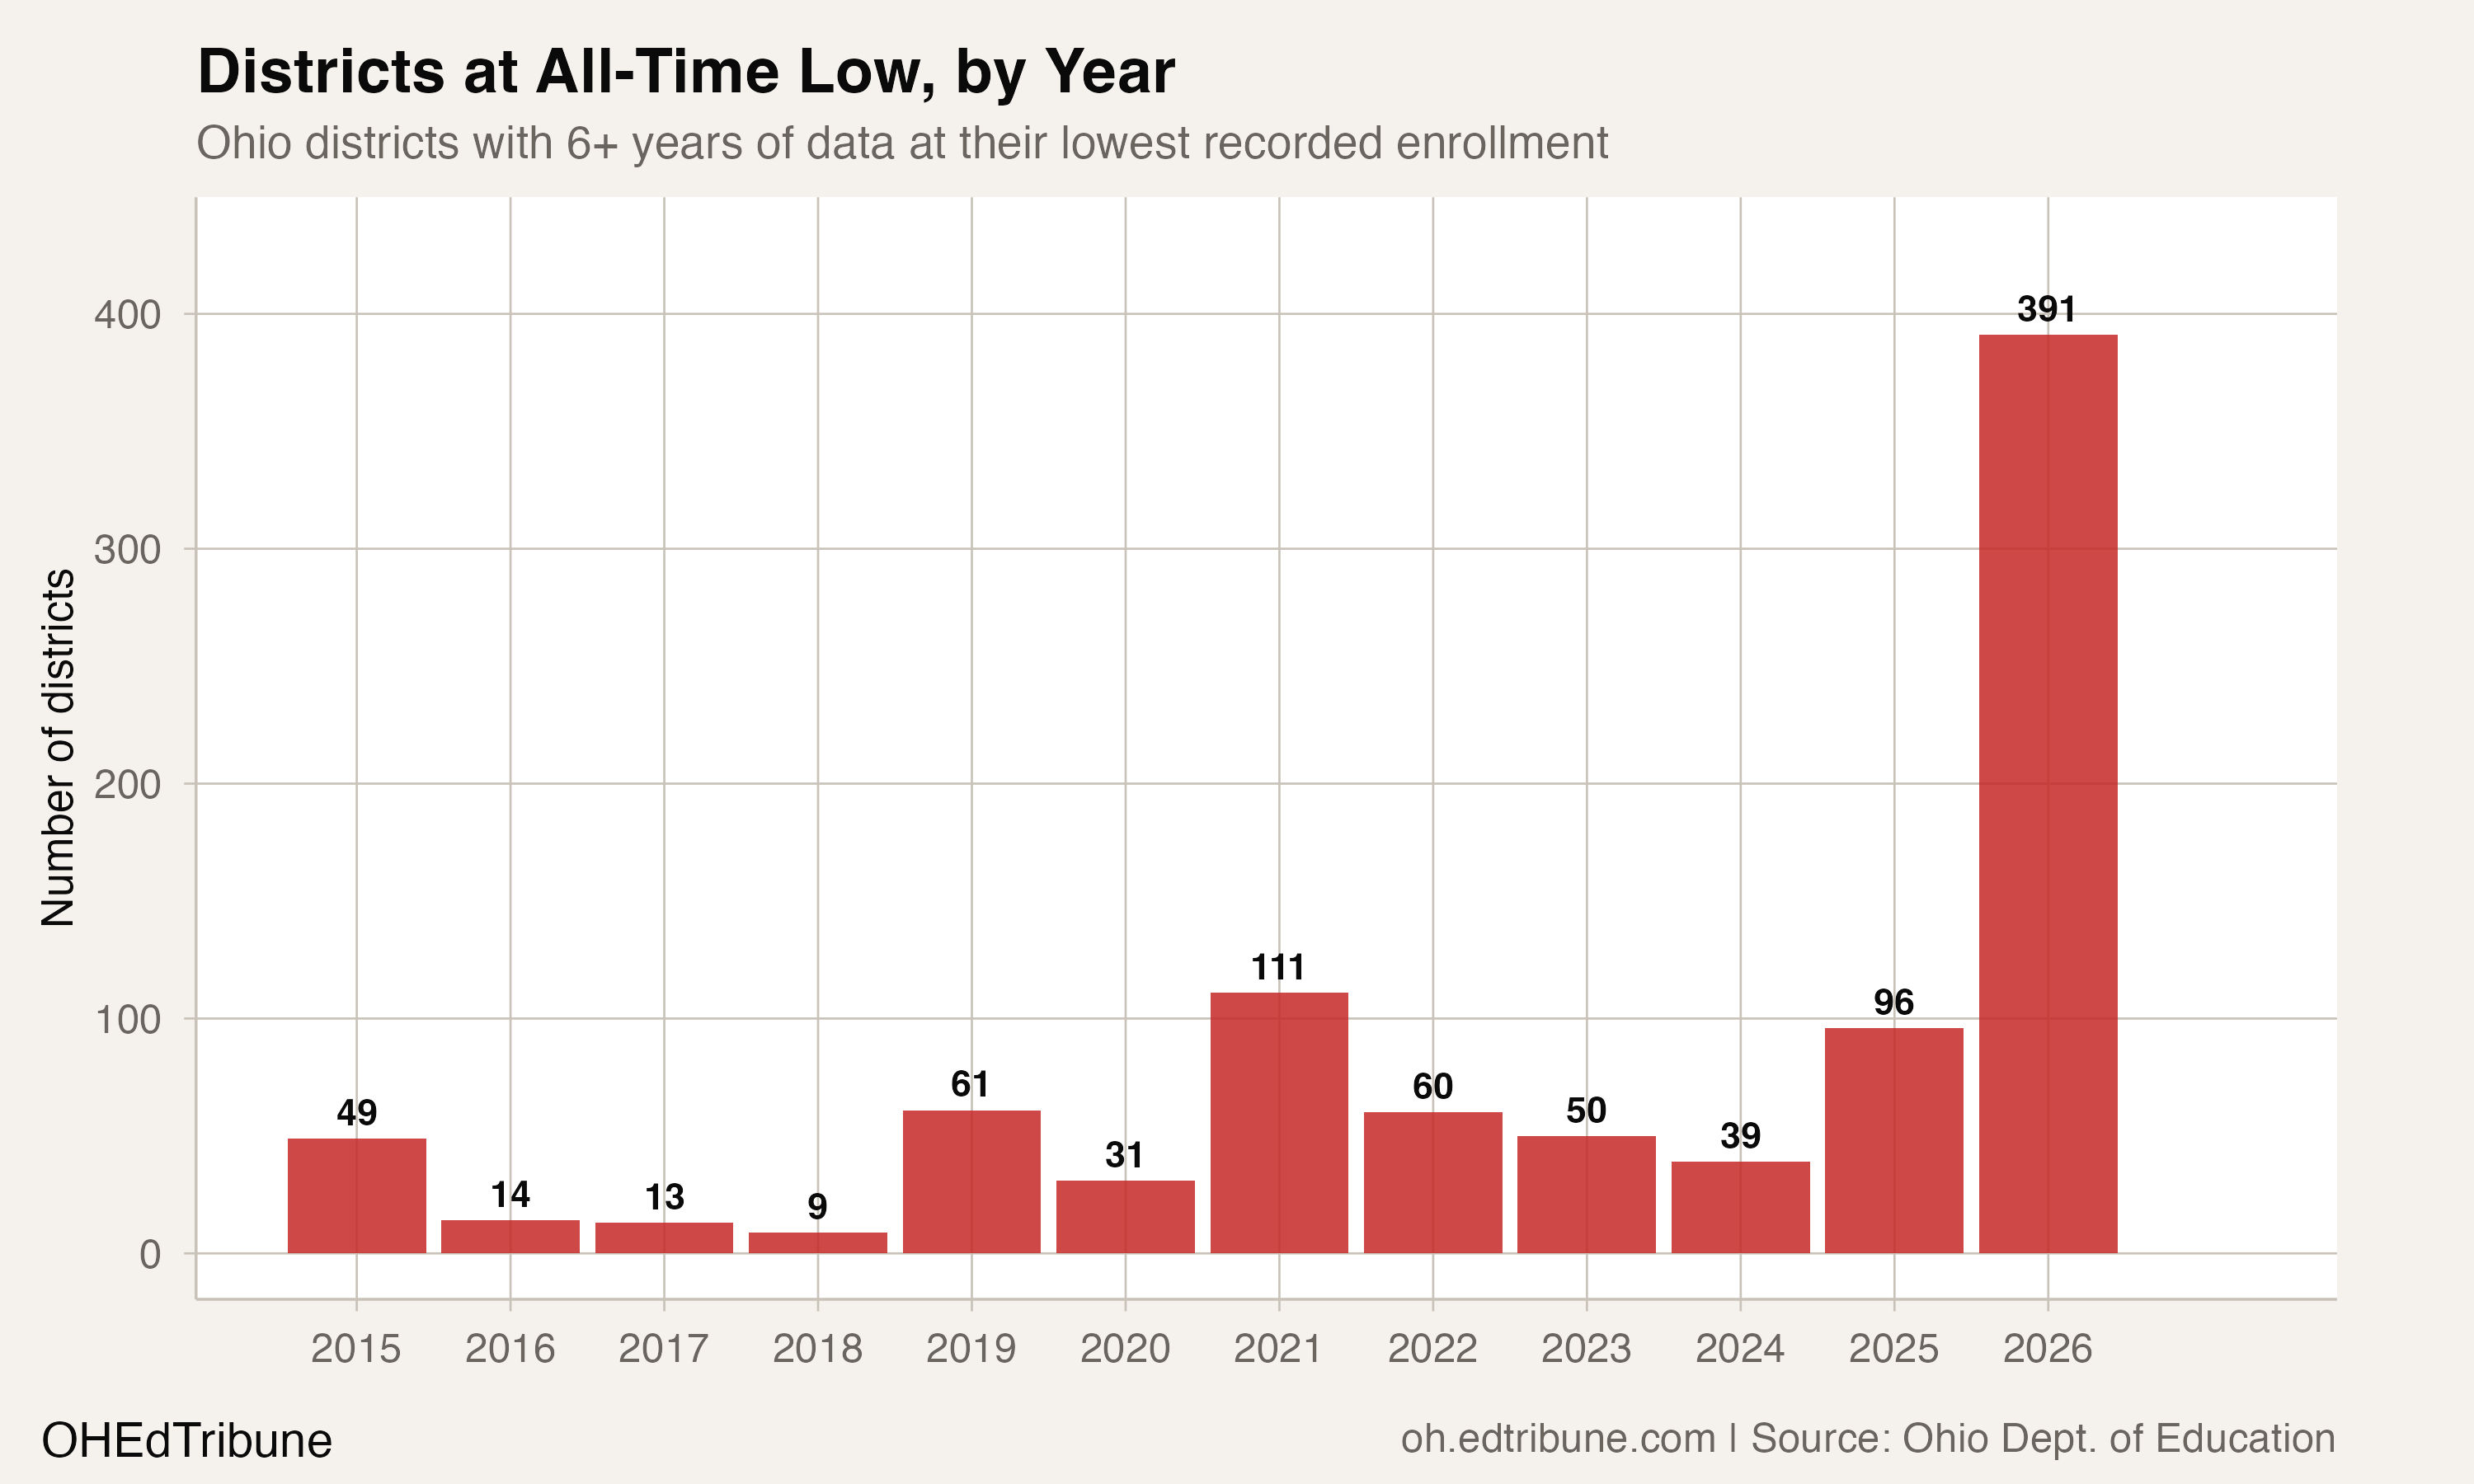
In 2024-25, 96 Ohio districts sat at their lowest enrollment on record. One year later, the number is 391.
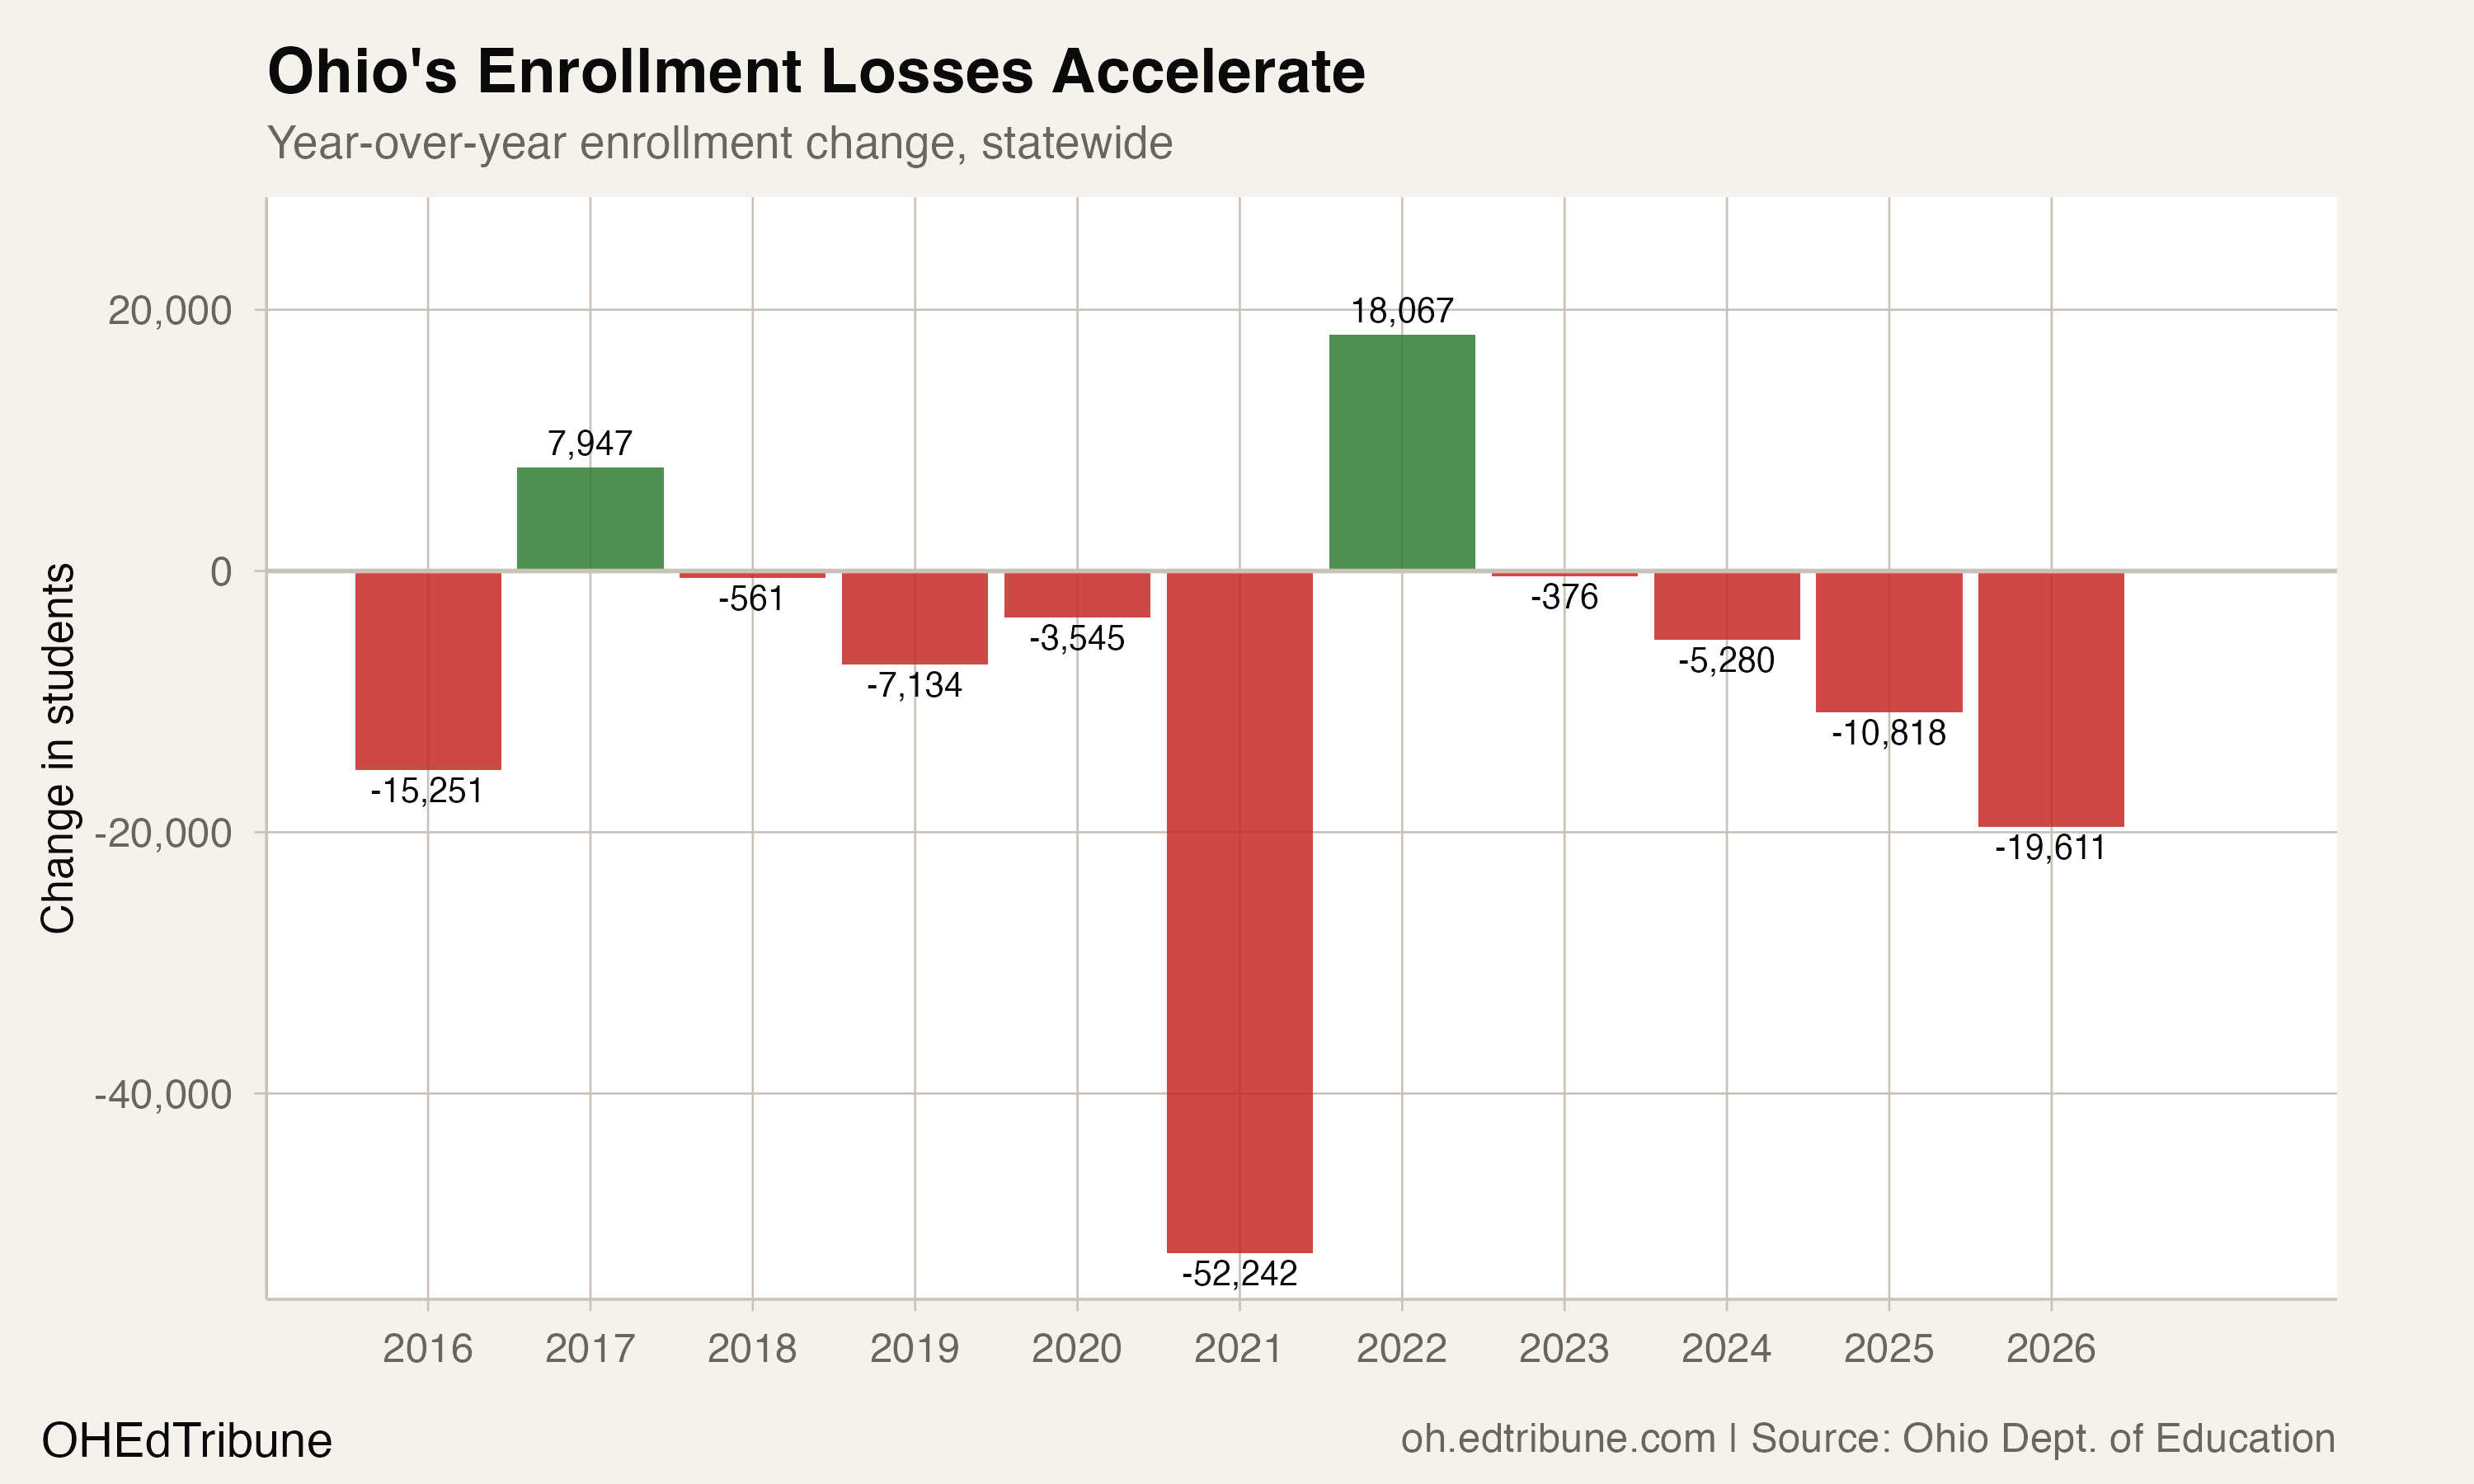
The quadrupling happened in a single year. Of 920 districts with at least six years of data, 42.5% recorded their lowest enrollment ever in 2025-26. Those 391 districts collectively enroll 783,901 students, nearly half of all students in the analyzed districts. The state lost 19,611 students this year, a 1.1% decline that is the largest single-year drop outside of the pandemic's 52,242-student plunge in 2020-21.
The wave did not spare the big districts
Every major urban district in Ohio except Columbus City Schools District↗ET and Dayton City↗ET is at its all-time low.
Cleveland Municipal↗ET has shed 16.7% of its enrollment since 2015, falling from 38,843 to 32,369. Cincinnati Public Schools↗ET peaked more recently, in 2020, and has since lost 2,778 students, a 7.7% decline. Toledo City↗ET is down 12.0% from its 2019 peak. Akron City↗ET has lost 10.0% since 2015. Canton City↗ET has lost a fifth of its students, dropping from 9,272 to 7,341 over the same span. Youngstown City↗ET is down 16.7% from 2019.
Columbus avoided the list because its enrollment, while well below its 2015 peak of 50,380, ticked up slightly from its 2023 trough of 45,352 to 45,781. Dayton, at 12,795, is 9.8% below its 2015 peak but not at its absolute minimum.
The crisis is not limited to cities. Suburban districts that were stable a decade ago are now at record lows: Parma City↗ET is down 19.3%, Willoughby-Eastlake City↗ET down 19.7%, Brunswick City↗ET down 21.1%, and Westerville City↗ET down 5.4%. All peaked between 2015 and 2019.
The middle is hollowing out
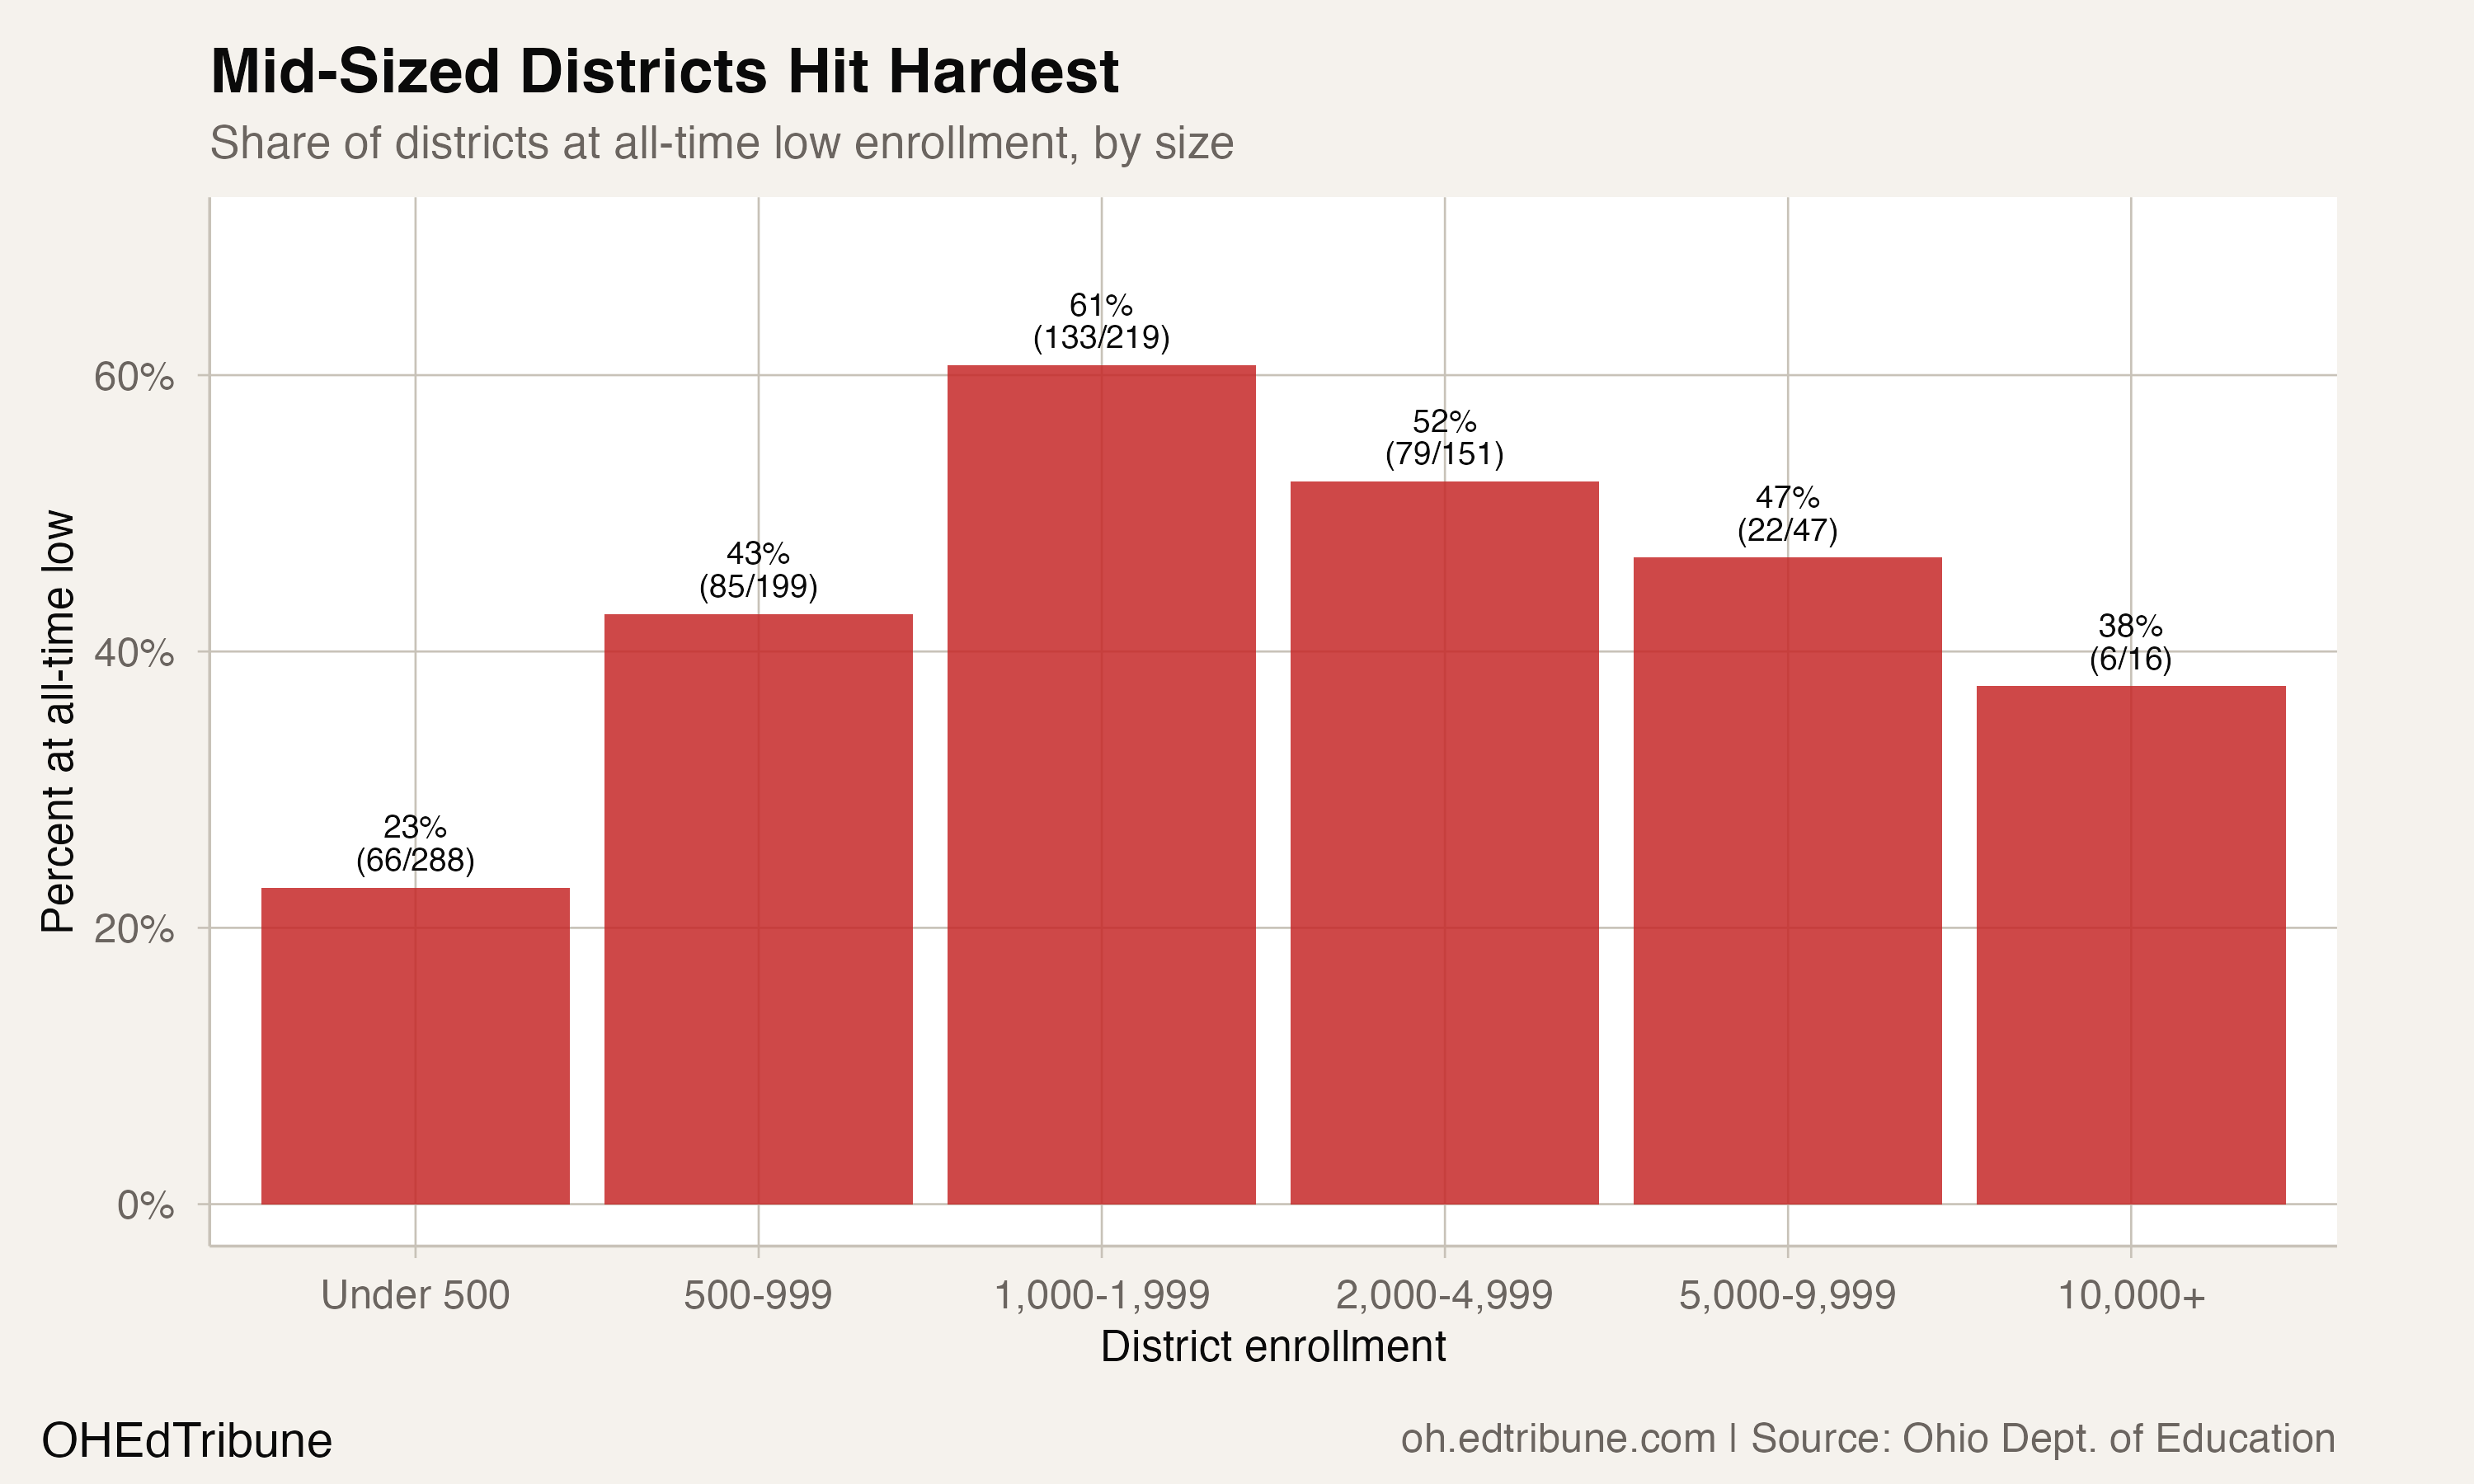
The pattern is not evenly distributed by district size. The highest rate of all-time lows is in the 1,000-to-1,999 student bracket, where 133 of 219 districts, 60.7%, are at their floor. Districts enrolling 2,000 to 4,999 are close behind at 52.3%. The smallest districts, those under 500 students, show the lowest rate at 22.9%, partly because many community schools in this bracket are still growing.
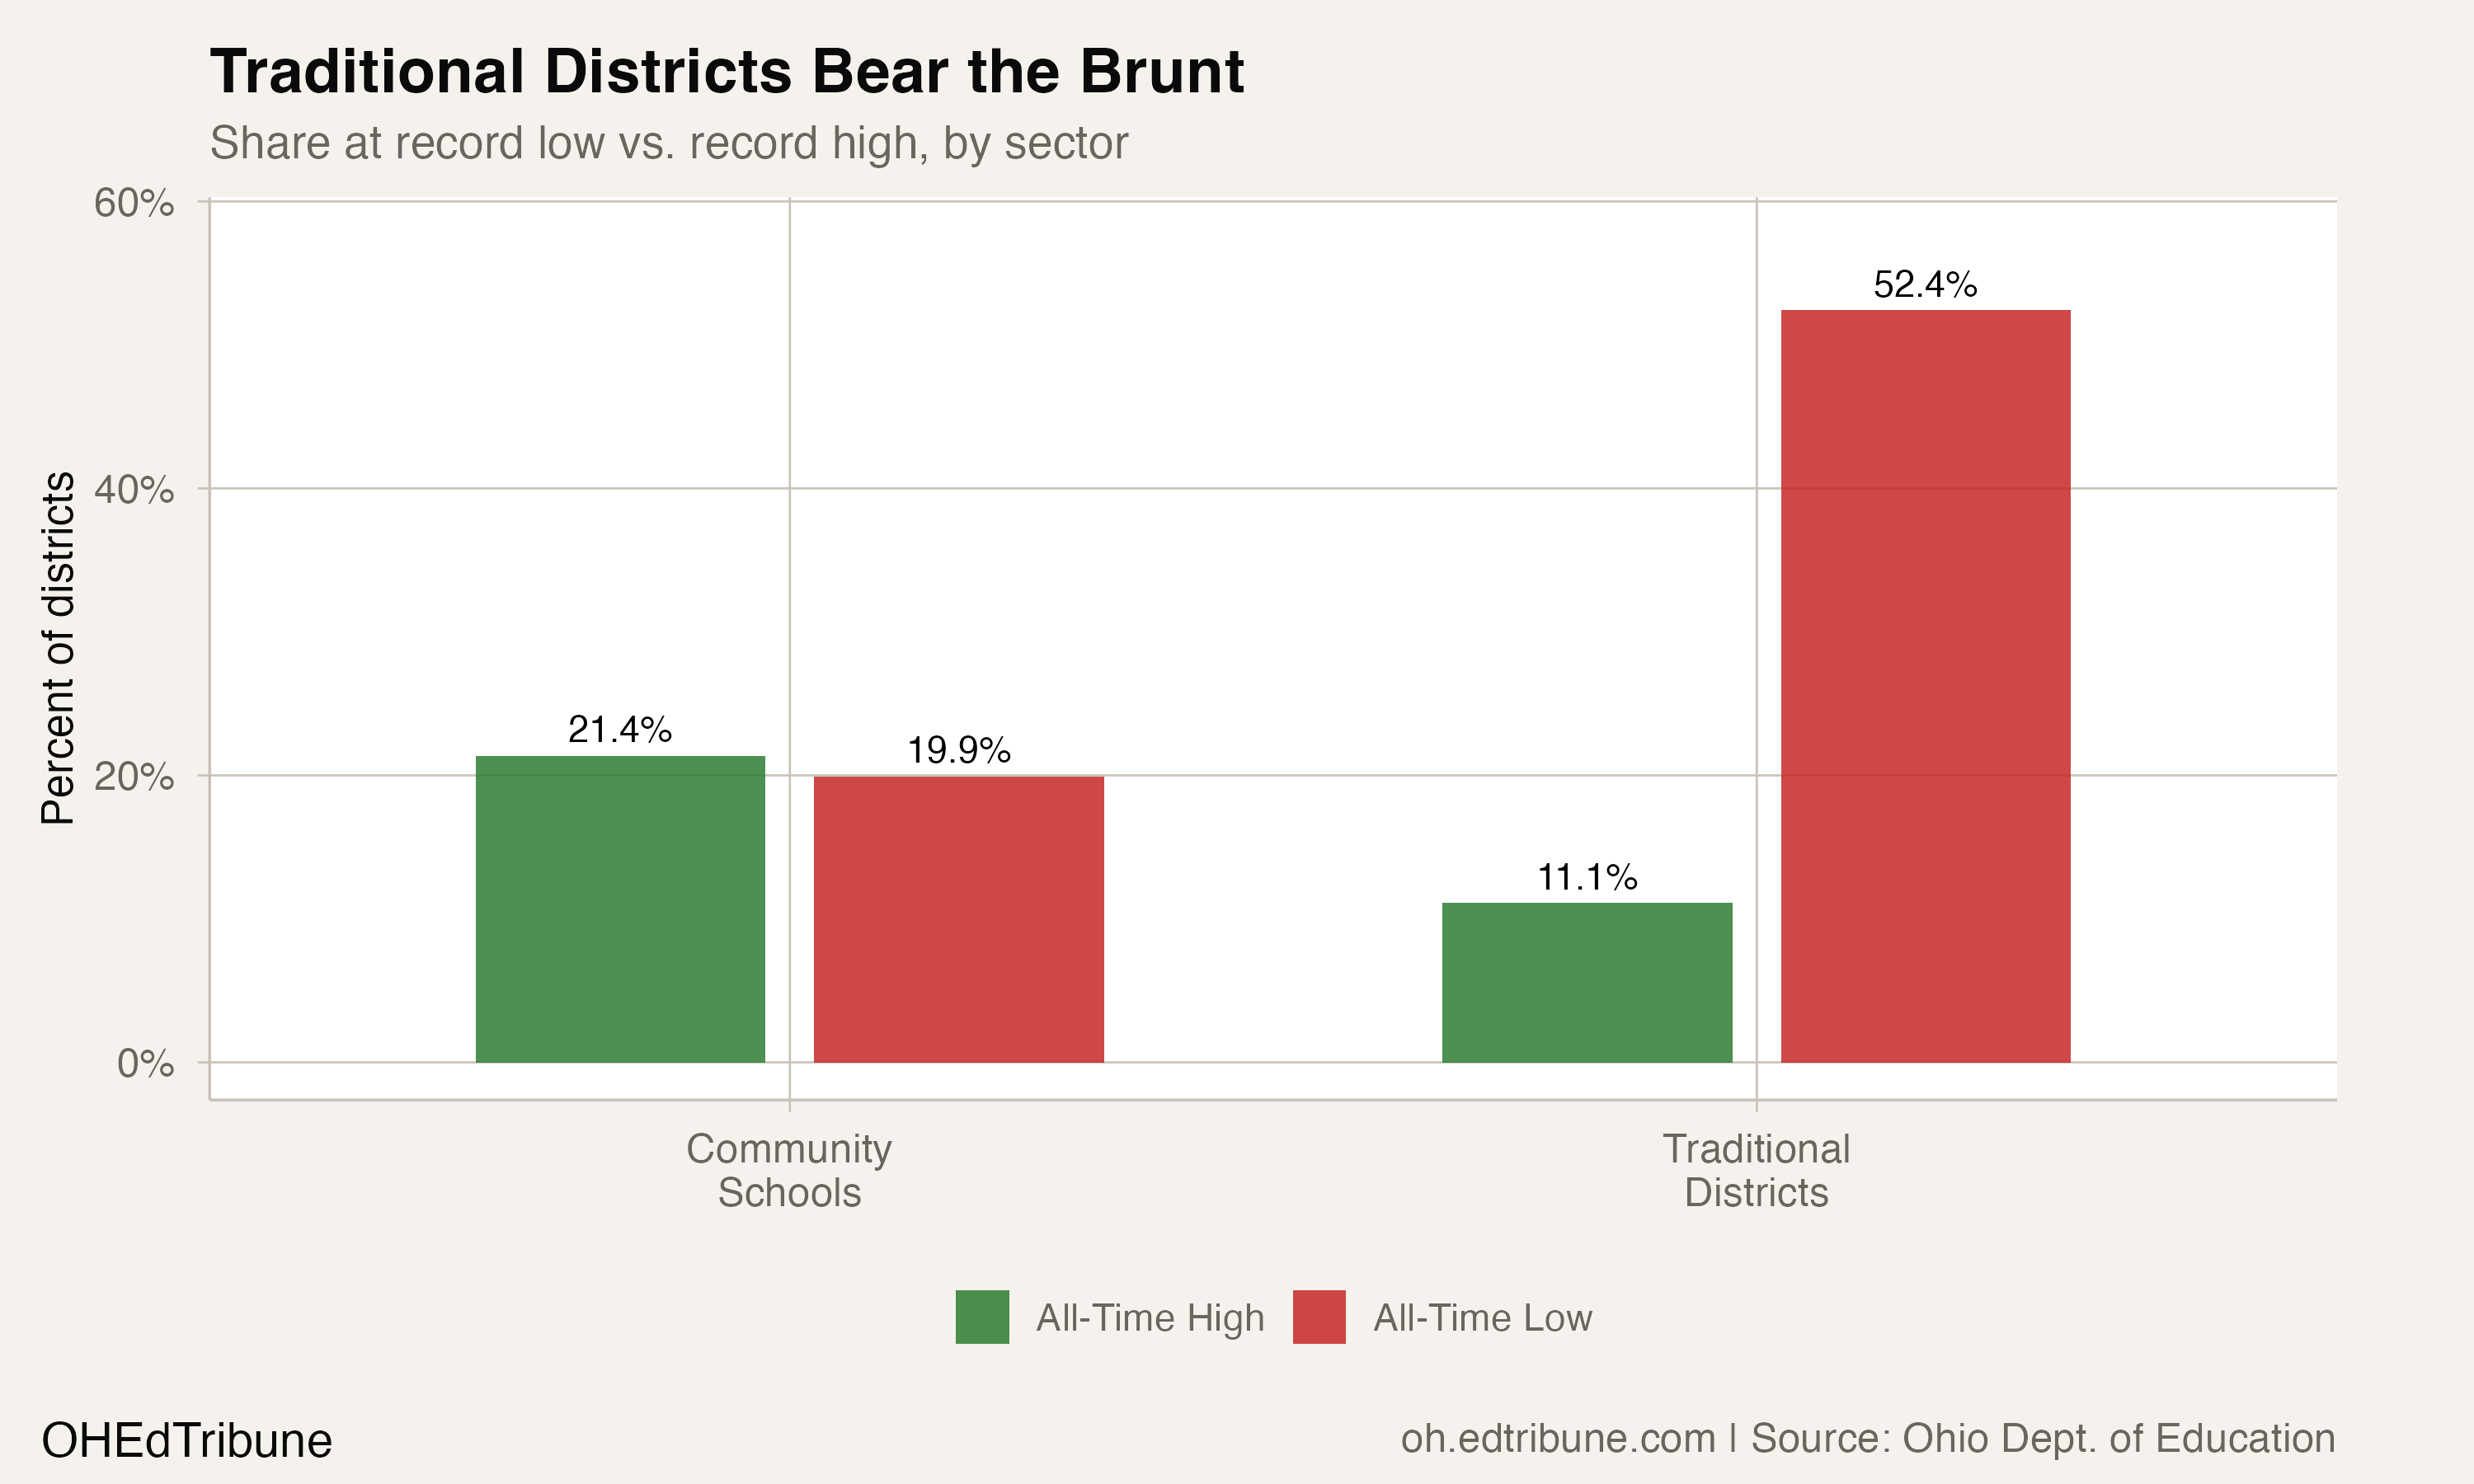
Among traditional districts only, the picture is starker. More than half, 335 of 639 (52.4%), are at all-time lows. Only 71 traditional districts (11.1%) are at all-time highs. Community schools show an inverted pattern: 21.4% are at all-time highs versus 19.9% at all-time lows.
Where the deepest damage runs
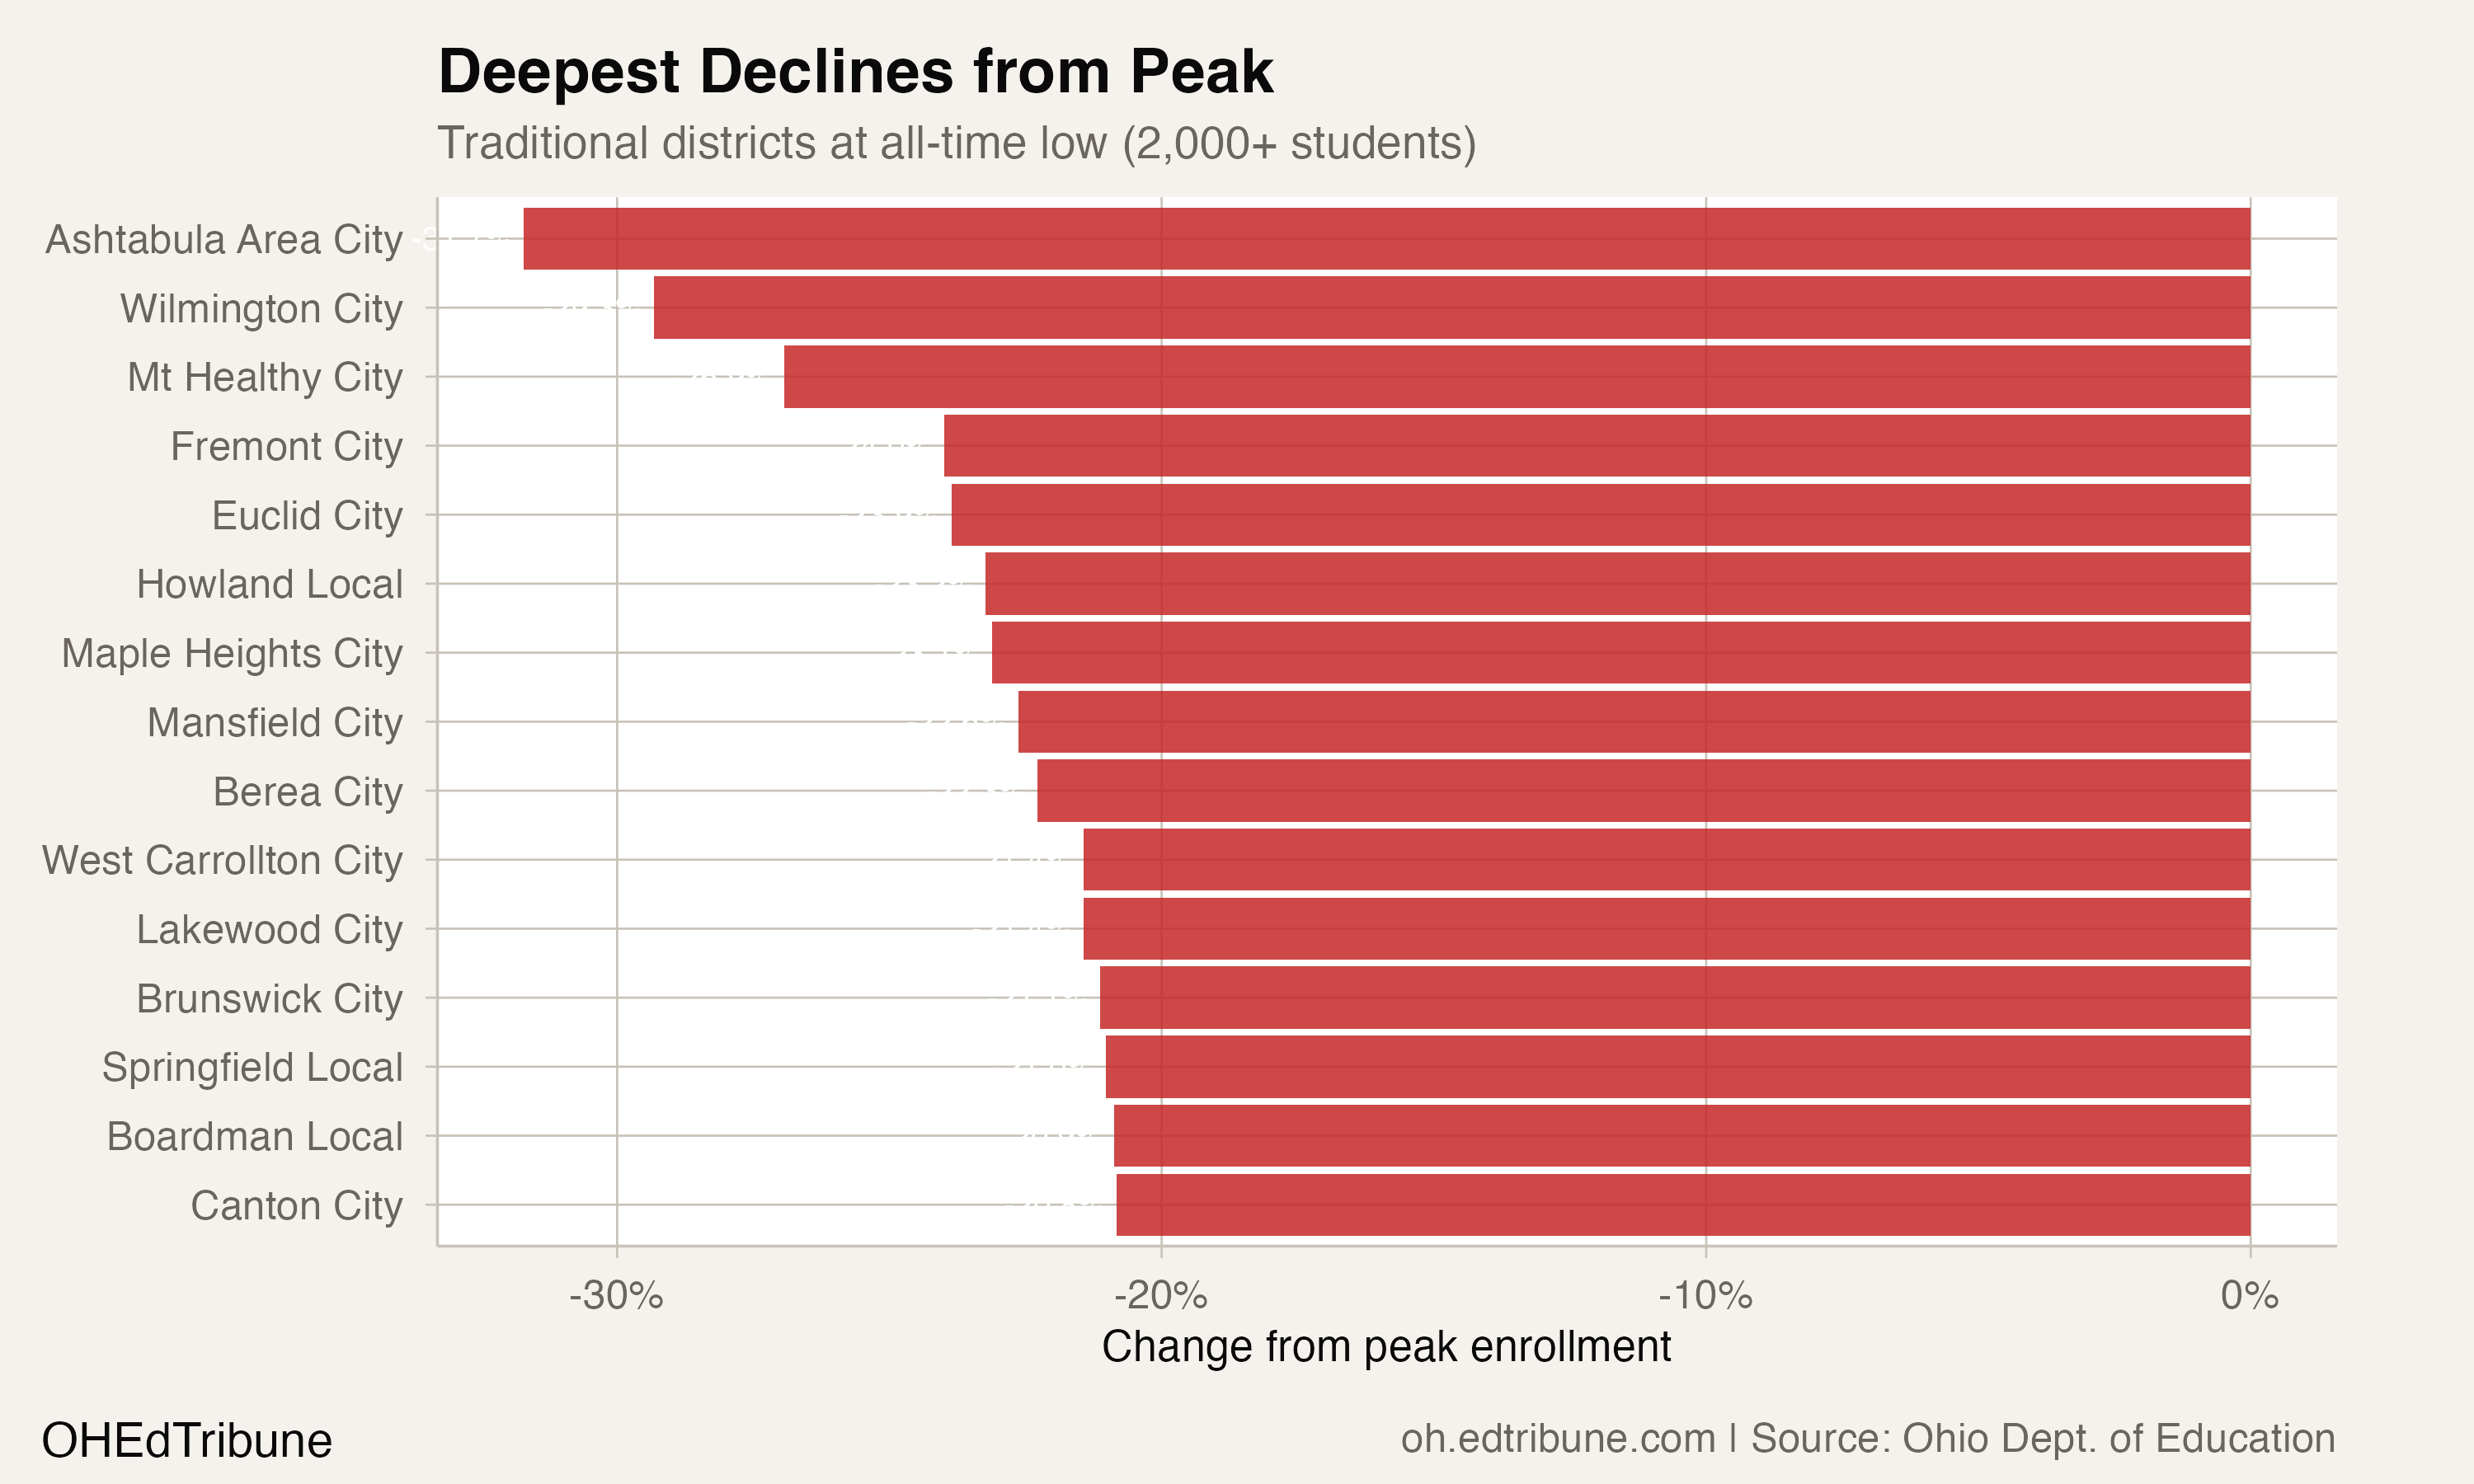
Among traditional districts with at least 2,000 students, Ashtabula Area City↗ET has lost 31.7% from its 2016 peak, falling from 3,642 to 2,487. Euclid City↗ET is down 23.9%. East Cleveland City School District↗ET, once a district of 2,491, enrolls 1,157 students, a 53.6% collapse since 2015.
Canton, Brunswick, and Boardman are all down more than 20% from peak. These are not rural hamlets running out of families. They are mid-sized districts in metro areas where the population has aged, birth cohorts have shrunk, and alternatives have multiplied.
Birth rates and the voucher question
Ohio's fertility rate fell to 56.4 births per 1,000 women in 2023, an 8.9% decline from the 2011-2020 average of 61.9. The children not born in 2013 and 2014 are the sixth and seventh graders missing from classrooms today. Aaron Churchill of the Thomas B. Fordham Institute has attributed the trend to structural demographics: "All the demographic factors with reduced childbirth rates... just means there are fewer kids to educate."
The view from Cleveland Metropolitan School District tracks that diagnosis. Asked what the district sees as Ohio absorbs its biggest non-COVID decline, Communications Officer Jon Benedict said the city's enrollment story is now demographic at its core. "Over the last 20 years, the Cleveland Metropolitan School District has lost more than 50% of its enrollment," he said. "While charter schools and vouchers played a role early in that period, it's become clear that the largest impact on our enrollment has been the decline in the birth rate within our city and resulting decline in overall population."
But birth rates alone do not explain why 2026 produced four times as many all-time lows as 2025. The EdChoice Expansion voucher program, which removed income limits in the 2023-24 school year, is a competing factor. In its first year without income caps, the state distributed nearly 69,000 new EdChoice Expansion vouchers, though Policy Matters Ohio found that private school enrollment grew by fewer than 3,700 students, suggesting approximately 65,000 of those vouchers went to families already using private schools. The governor's budget allocates $2.4 billion over two years for EdChoice Expansion.
The enrollment data alone cannot distinguish how much of the 2026 decline reflects fewer children, how much reflects students leaving for voucher-funded private schools, and how much reflects families choosing homeschooling or out-of-state moves. What the data does show is that the losses are accelerating: the combined drop from 2024 to 2026, at 30,429, exceeds the state's entire post-COVID recovery of 18,067 in 2021-22.
The Columbus exception
Only 131 districts (14.2%) are at all-time highs. Nearly all the traditional districts in that group are Columbus-area suburbs. Olentangy Local↗ET, at 24,362 students, is at its peak. So is Dublin City↗ET at 16,963. Pickerington Local (11,856), Worthington City (10,752), and Gahanna-Jefferson City (8,338) round out the top five traditional districts at record highs.
The Ohio Department of Development projects that Ohio as a whole will lose 675,000 residents by 2050. Meanwhile, MORPC's population forecast projects the 15-county central Ohio region will add 726,000 people over the same period, reaching 3.15 million residents. School enrollment is following the same divergence: the state empties while its capital region fills.
The funding math that follows
Ohio's school funding formula includes a "guarantee" provision that shields districts from funding reductions when enrollment drops. Governor DeWine's office has framed this as funding "empty desks," and his budget proposal would phase down the guarantee, reducing it to 95% in fiscal year 2026 and 90% in 2027. More than half of traditional districts would receive less state funding under the plan, even as the budget allocates $2.4 billion for voucher programs, a 16.5% increase. For the 391 districts at all-time lows, the guarantee cut would accelerate the fiscal consequences of enrollment losses that the formula has so far cushioned.
For a district like Canton, which peaked at 9,272 students in 2015 and now enrolls 7,341, the guarantee has papered over a 20.8% enrollment decline. If the guarantee shrinks, Canton's budget will confront a 20% enrollment loss that its revenue has not yet reflected. Buildings designed for 9,000 students do not become cheaper to heat when 7,000 show up.
Ohio added 96 districts to the all-time-low list in 2025. This year it added 295 more. The combined drop from 2024 to 2026, at 30,429 students, exceeds the state's entire post-COVID recovery of 18,067 in a single bounce-back year. The recovery is gone. The districts at their floor are still digging.
Detailed code that reproduces the analysis and figures in this article is available exclusively to EdTribune subscribers.
Discussion
Sign in to join the discussion.
Loading comments...