Part of the Ohio Enrollment 2026ET series.
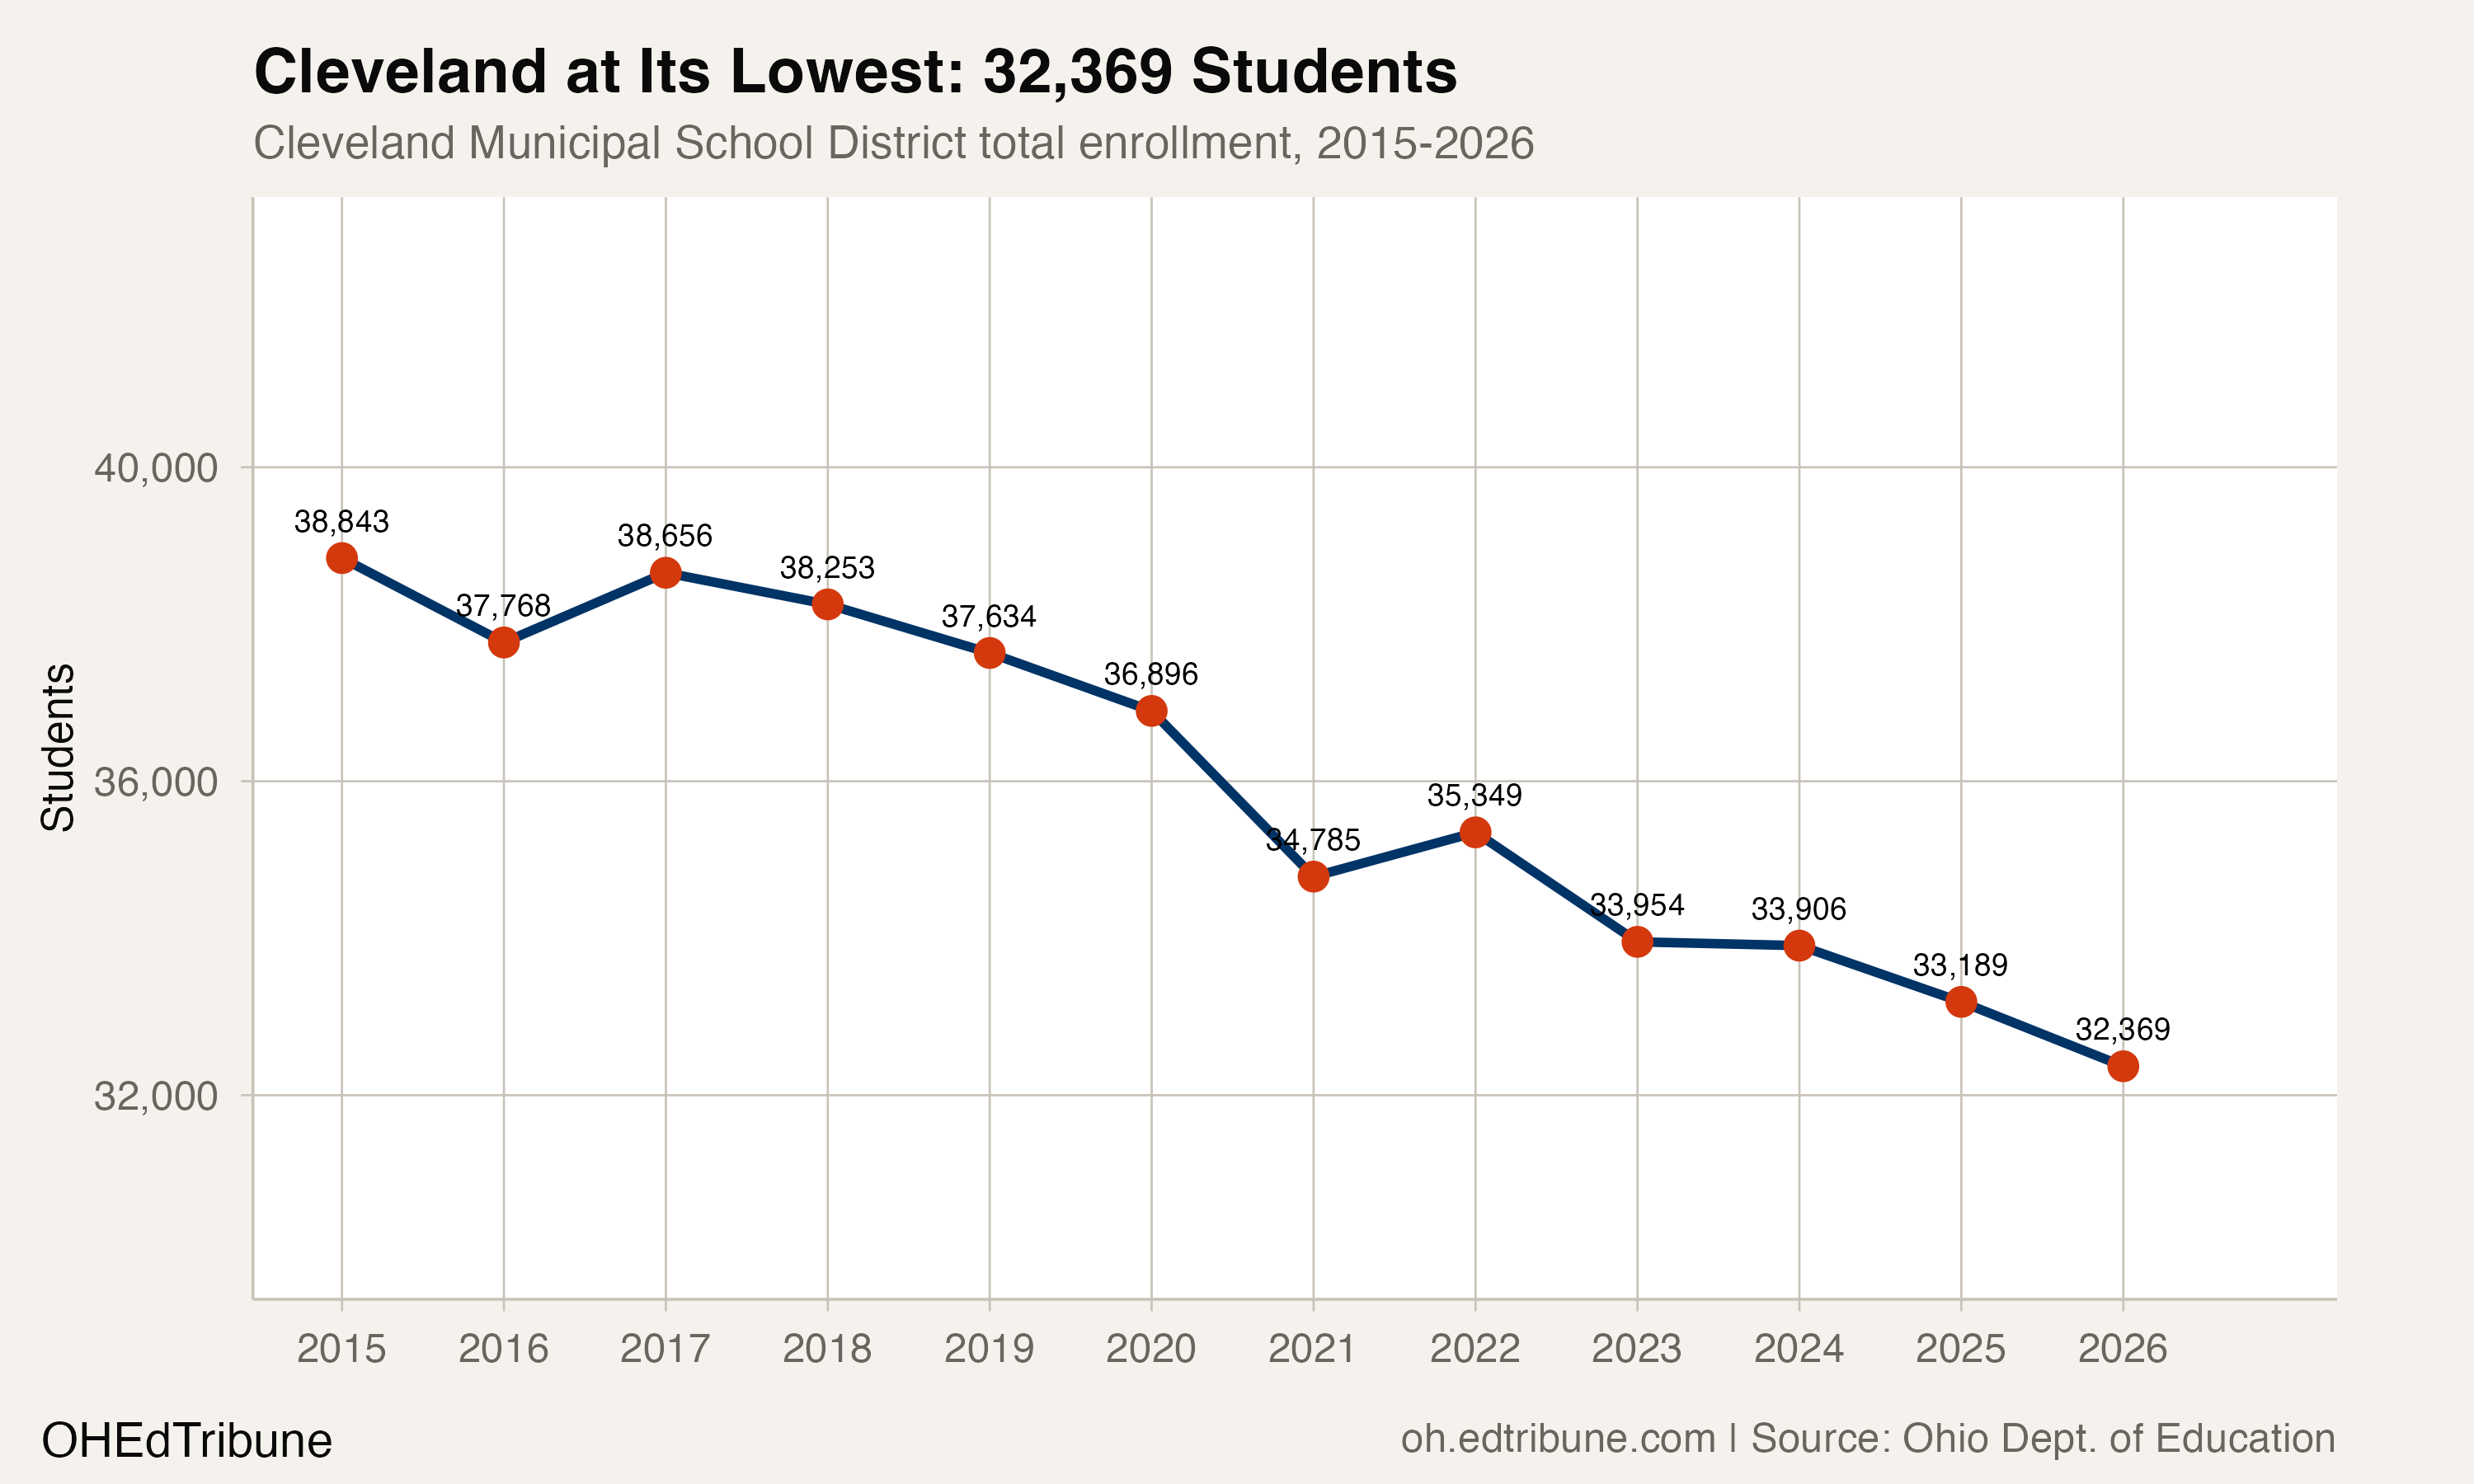
Cleveland Municipal↗ET enrolled 32,369 students in 2025-26, the lowest figure in the district's modern records. That number is 6,474 fewer than in 2014-15, a 16.7% decline. By the district's own accounting, the trajectory stretches much further back: enrollment has been cut roughly in half since 2004, when CMSD served approximately 70,000 students. In December, the school board voted 9-0 to close or merge 29 schools and vacate 18 buildings, the largest single restructuring in the district's history.
The closures are not optional. They are an attempt to match a school system built for 70,000 students to a district that now serves fewer than 33,000, while staring down a $150 million deficit over the next three years.
The downward staircase
In the 12 years of data available, Cleveland has declined in nine. The only two upticks were modest: a partial recovery of 888 students in 2016-17, and a post-COVID bounce of 564 in 2021-22. Neither lasted. Since that 2022 bounce, the district has lost 2,980 students in four consecutive years of decline, erasing the recovery and then some.
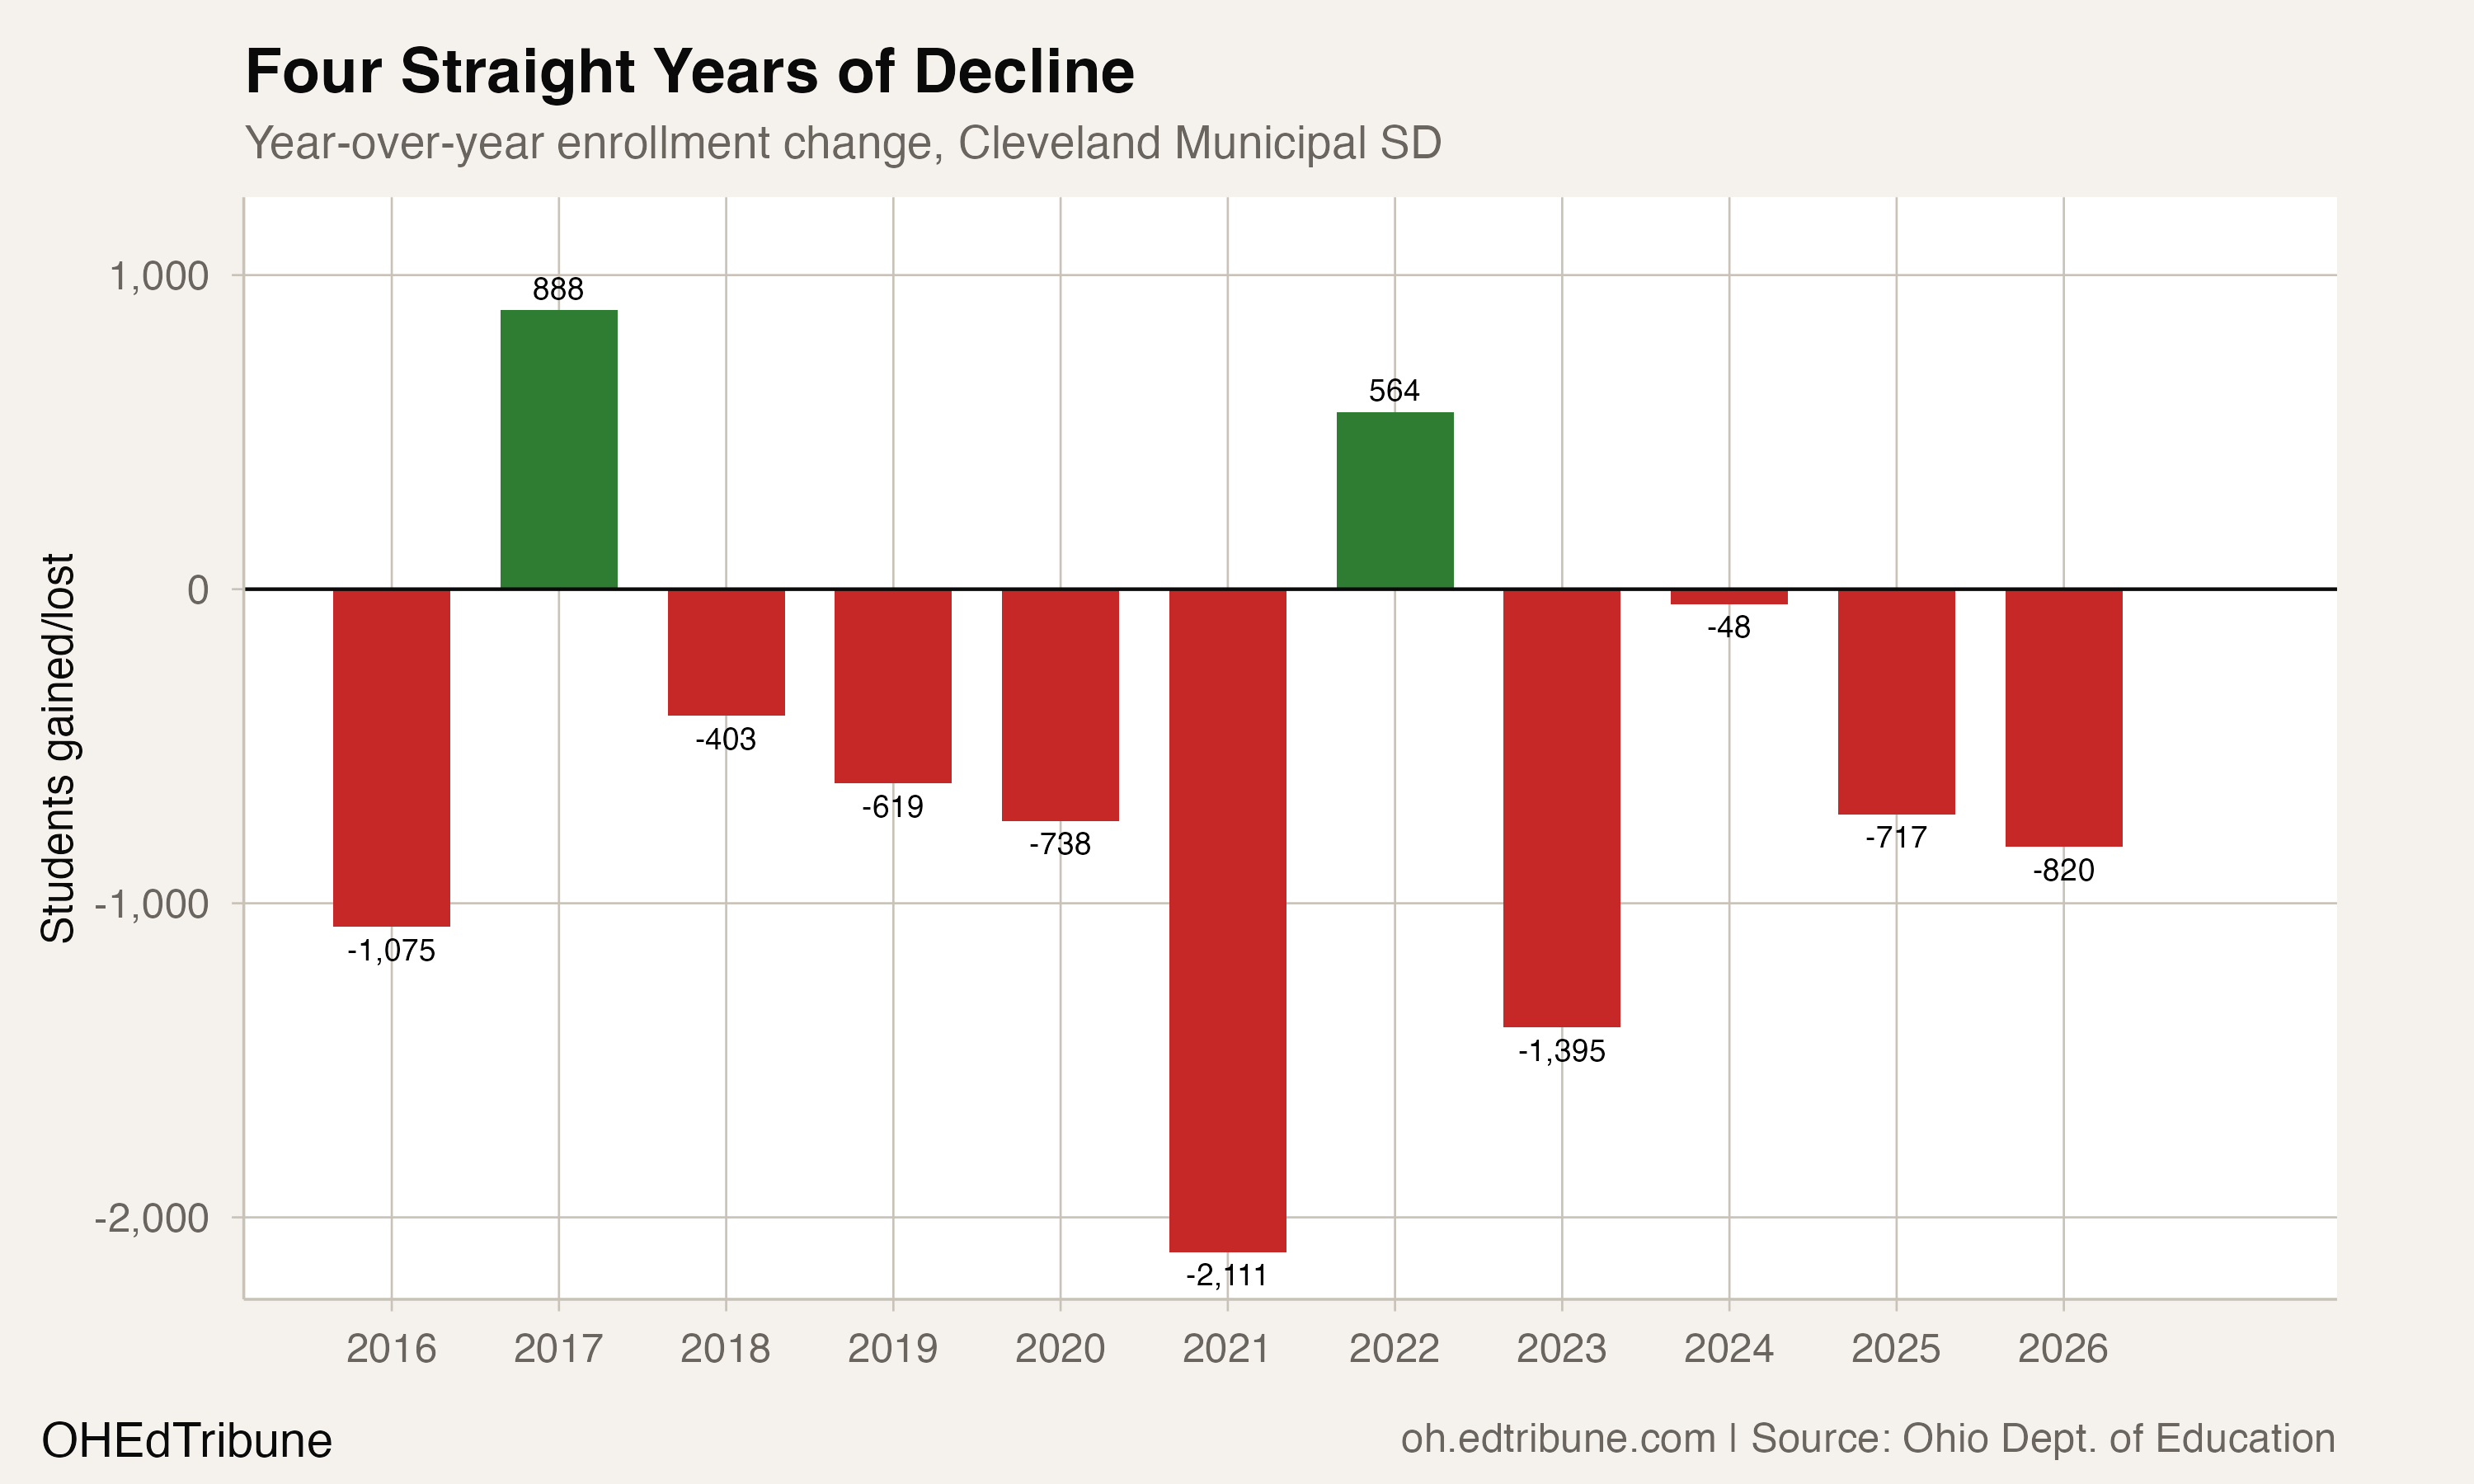
The COVID year of 2020-21 stands out: 2,111 students disappeared in a single year, a 5.7% drop. But the post-pandemic period has been nearly as destructive in aggregate. The four-year slide from 35,349 to 32,369 represents a loss of 8.4%. After the sharp 1,395-student drop in 2022-23, the next year's decline of just 48 may have suggested stabilization. It did not. Losses of 717 and 820 followed.
Cleveland is now Ohio's third-largest traditional district, behind Columbus City Schools (45,781) and Cincinnati Public Schools (33,213). Cincinnati, notably, has gained 1.7% since 2015. Columbus has lost 9.1%. Cleveland's 16.7% decline is nearly double that of Columbus and stands in sharp contrast to Cincinnati's stability.
Building Brighter Futures, with fewer buildings
The district's consolidation plan, called Building Brighter Futures, reduces PreK-8 schools from 61 to 45 and high schools from 27 to 14. The restructuring is expected to save approximately $30 million annually, primarily through reduced staffing. Eighteen district-owned buildings will close. Five leases will end.
The plan established minimum enrollment thresholds: 450 students for K-8 schools, 500 for high schools. Many Cleveland buildings fell well below those floors. When a school with 200 students occupies a building designed for 600, the per-pupil cost of maintaining that facility becomes unsustainable regardless of instruction quality.
Around 5,000 students will change buildings in fall 2026. As of late February, only 50% of affected students had selected a CMSD school through the district's choice portal, raising the prospect that closures could accelerate the very enrollment losses they were designed to manage.
One in four students receives special education
The most striking shift in Cleveland's student body is not its size but its composition. Special education enrollment has risen from 8,465 students (21.8% of the total) in 2015 to 8,883 (27.4%) in 2026. The absolute count grew by 418 while overall enrollment fell by 6,474. More than one in four CMSD students now receives special education services. Part of this share increase is mechanical: when overall enrollment shrinks faster than special education enrollment, the ratio rises even without more students being identified. But the absolute growth of 418 students, against a backdrop of 6,474 total departures, indicates expanded identification as well.
That ratio has made the consolidation plan especially fraught. The Cleveland Teachers Union described the district's approach to special education placement as "abhorrent", after hundreds of families received letters indicating their children might not transfer to the same school as their peers.
"They received a form letter from the district informing them that their children may not be transferring to their consolidated school with the rest of their peers." — Shari Obrenski, Cleveland Teachers Union President, Ideastream, Dec. 2025
Not every receiving school has the individual resource rooms and specialized classrooms that students' IEPs require. The instructional programs these students receive carry higher per-pupil costs, and concentrating them into fewer buildings could strain both space and staffing at the surviving schools.
Separately, English learner enrollment grew from 3,679 (9.8%) in 2019 to 4,268 (13.2%) in 2026. That growth is tightly linked to the district's rising Hispanic enrollment.
The demographic transformation
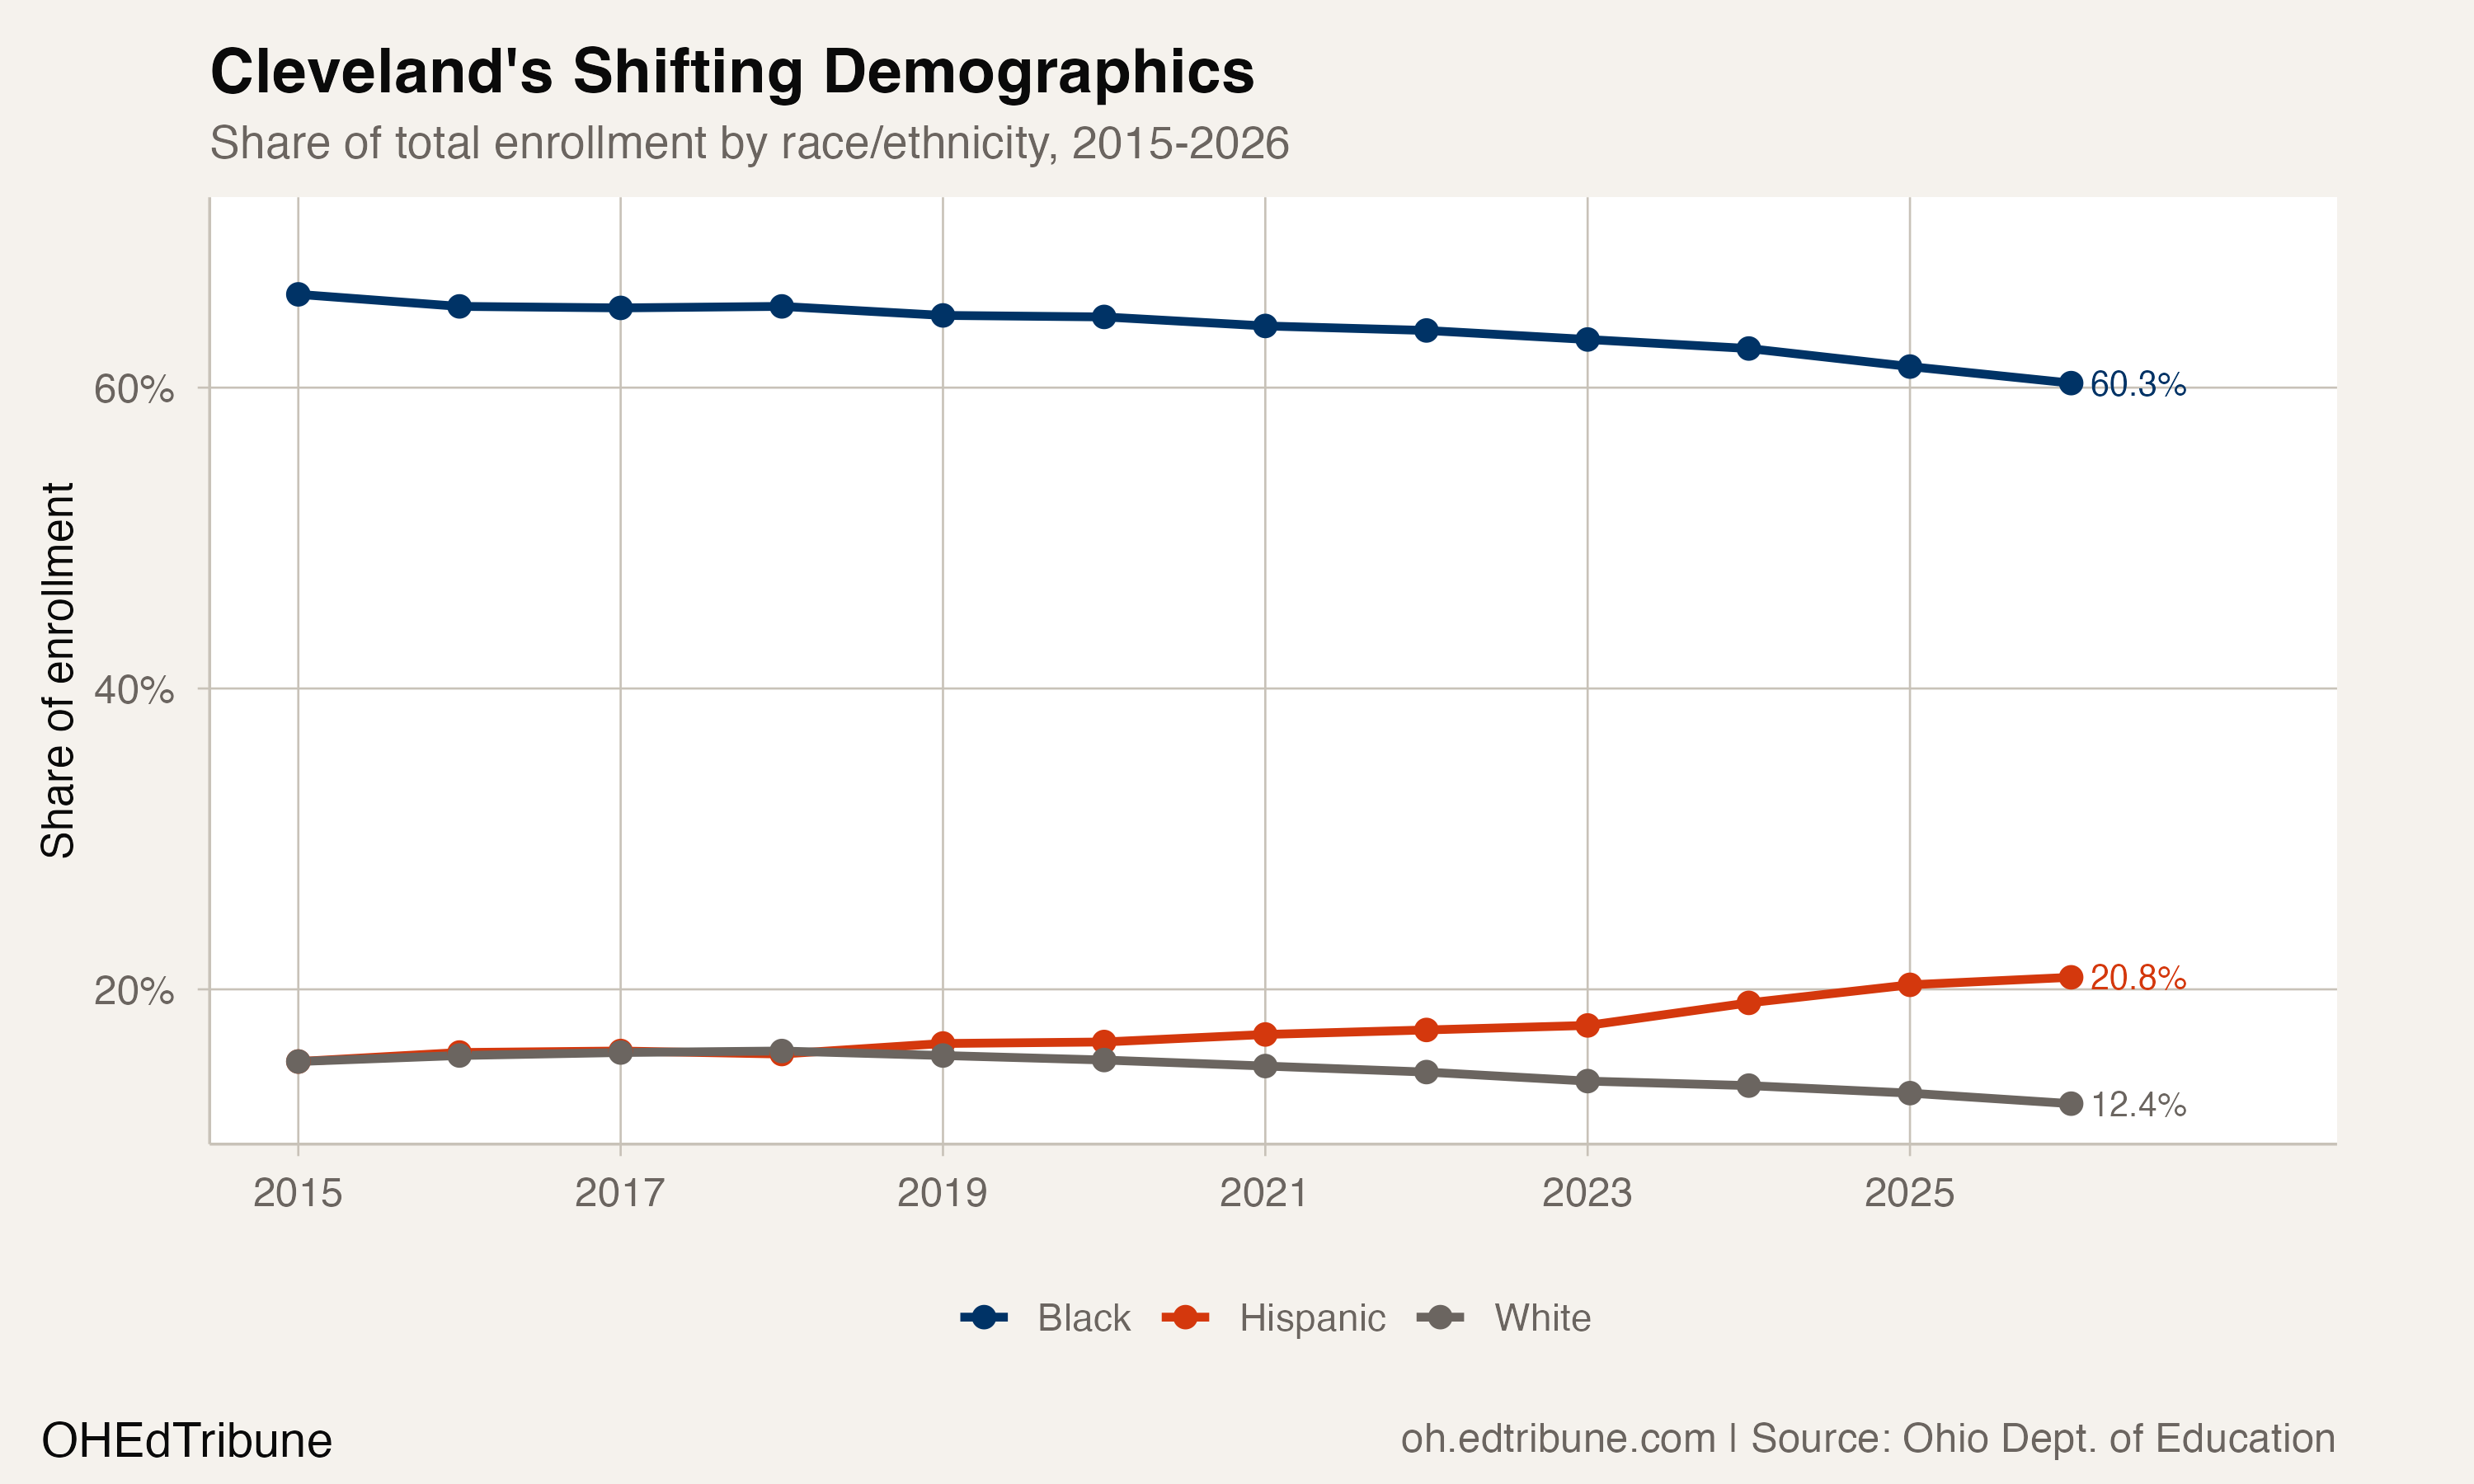
Cleveland remains a predominantly Black district, but the proportions are shifting. Black enrollment fell from 25,714 (66.2%) in 2015 to 19,514 (60.3%) in 2026, a loss of 6,200 students. White enrollment dropped from 5,904 (15.2%) to 4,021 (12.4%), down by 1,883. Hispanic enrollment, by contrast, grew from 5,894 (15.2%) to 6,745 (20.8%), a gain of 851 students. Multiracial enrollment rose 43.5%, from 1,044 to 1,498.
The net effect: Black students accounted for roughly 96% of Cleveland's total enrollment loss. Hispanic enrollment growth partially offset that decline but could not overcome it.
Every suburb is losing too

Cleveland's decline is not happening in isolation. Across Cuyahoga County's traditional districts, total enrollment fell from 148,106 to 125,874 between 2015 and 2026, a loss of 22,232 students (15.0%). Cleveland accounts for 29.1% of that county-wide loss.
Every traditional district in the county with more than 500 students lost enrollment over this period. East Cleveland↗ET lost 53.6% of its students, falling from 2,491 to 1,157. Garfield Heights↗ET lost 28.0%. Euclid↗ET lost 23.3%. Affluent suburbs were not spared: Shaker Heights↗ET lost 19.7%, Chagrin Falls↗ET lost 19.9%, Westlake↗ET lost 15.9%.
Only three traditional districts in the county gained any enrollment at all. Strongsville↗ET added six students. Beachwood↗ET grew 9.0%. Warrensville Heights↗ET grew 27.7%, though from a small base of 1,522.
Cuyahoga County lost nearly 44,000 residents between 2013 and 2023, with Cleveland accounting for the largest share. The school enrollment data mirrors that population trajectory almost precisely.
The kindergarten signal
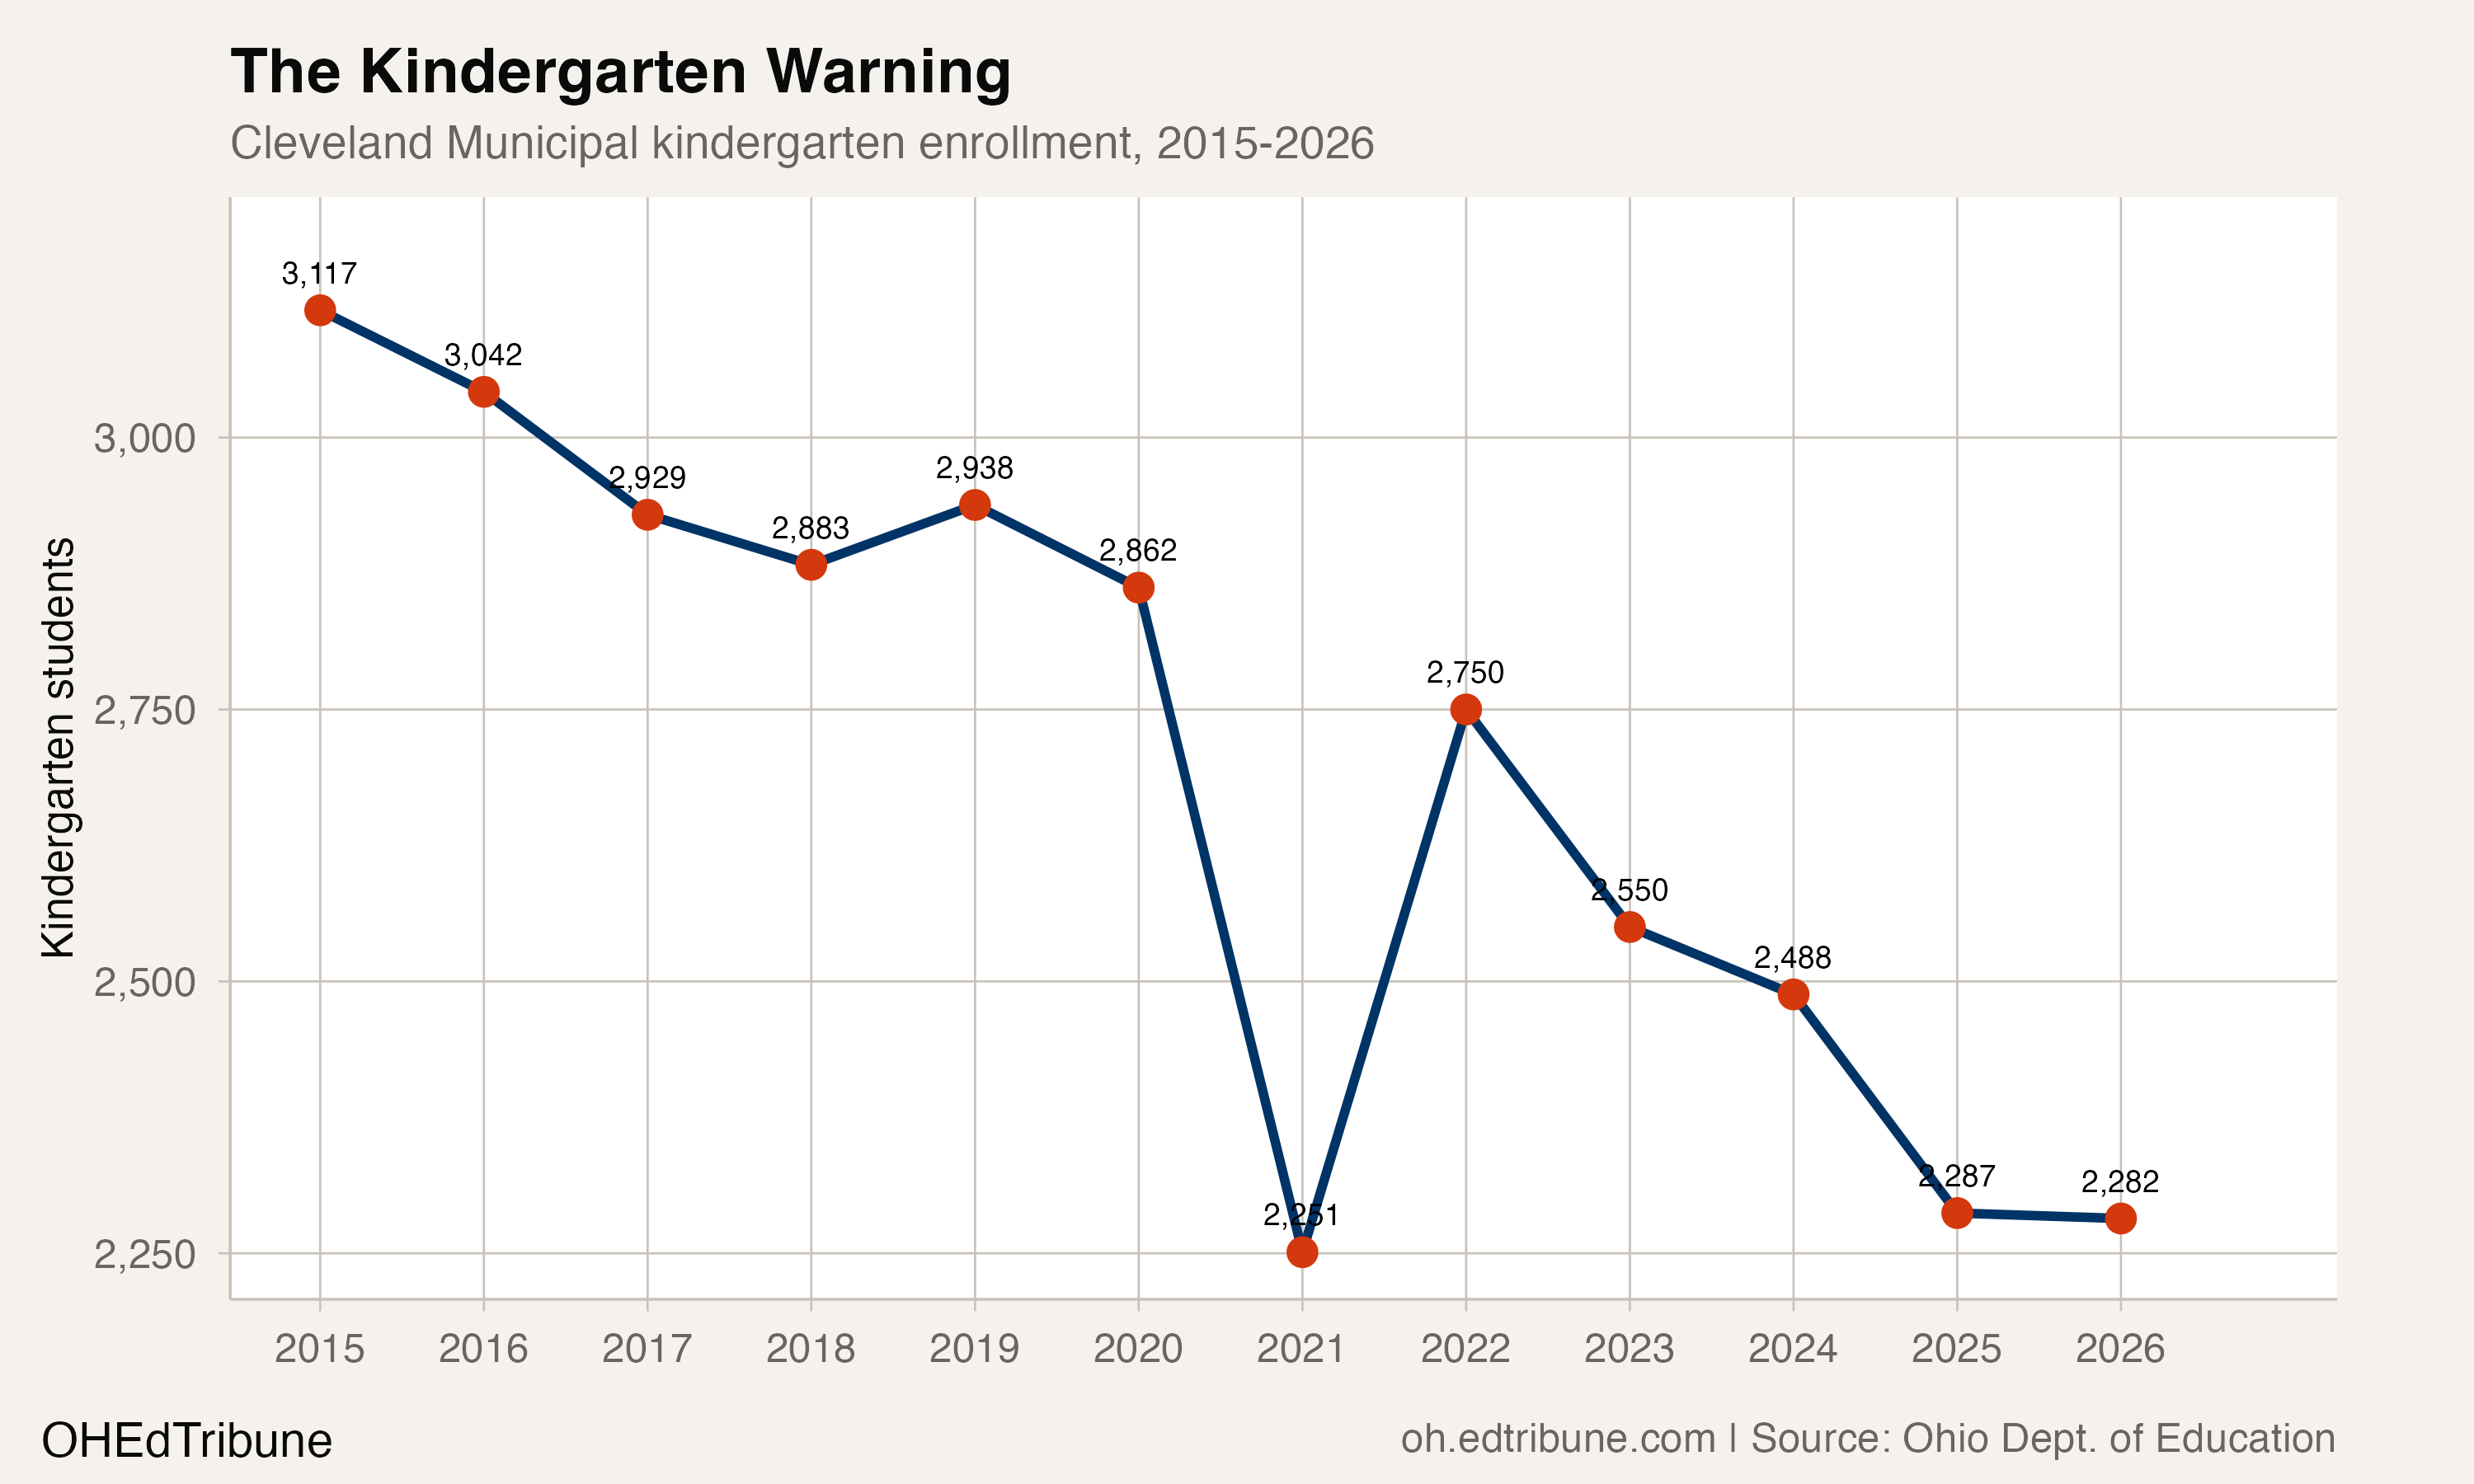
Cleveland enrolled 2,282 kindergartners in 2025-26, down 26.8% from 3,117 in 2014-15. The kindergarten class is the leading indicator of total enrollment five to twelve years out. If current kindergarten cohorts hold, the district's total enrollment will continue falling into the early 2030s even if no additional families leave.
The 2020-21 COVID year cratered kindergarten to 2,251. It partially recovered to 2,750 in 2021-22 but has declined every year since, settling at 2,282 and 2,287 in the last two years. The kindergarten pipeline has essentially flatlined at a level 27% below where it stood a decade ago.
What the closures cannot fix
The $30 million in annual savings from consolidation addresses only a fraction of the $150 million shortfall. The district has acknowledged that additional cuts to central office and administrative costs will be necessary. The deeper structural problem is a per-pupil funding system in which every departing student carries state dollars out the door, while fixed costs in transportation, facilities, and specialized instruction do not shrink proportionally.
The consolidation also carries retention risk. Parents at community meetings expressed frustration with the plan, citing disrupted routines, lost access to small-school settings, and hour-long bus rides to merged buildings.
Only half of affected families had chosen a CMSD school by the February deadline. The other half were still deciding, and some portion will not choose CMSD at all. Around 5,000 students are changing buildings in fall 2026. In a district that lost 820 students last year without any school closures, the consolidation is a bet that fewer, fuller buildings can hold families that empty hallways could not.
Detailed code that reproduces the analysis and figures in this article is available exclusively to EdTribune subscribers.
Discussion
Sign in to join the discussion.
Loading comments...