Correction (July 21, 2026): An earlier version misstated the economically disadvantaged enrollment share and mixed state-package results with unsupported baseline, policy, causal, and forecast claims. Executed Ohio enrollment data put that share at 59.6%. This version removes the unsupported material, distinguishes current district rows from matched district panels, and rebuilds every chart and claim from fresh package output.
Ohio's statewide chronic absenteeism rate improved in every year covered by the current state package. The size of that improvement, however, shrank in each transition.
The rate fell from 30.2% in 2021-22 to 26.8% in 2022-23, 25.6% in 2023-24, and 25.1% in 2024-25. Those changes were declines of 3.4 percentage points, 1.2 points, and 0.5 points, respectively.
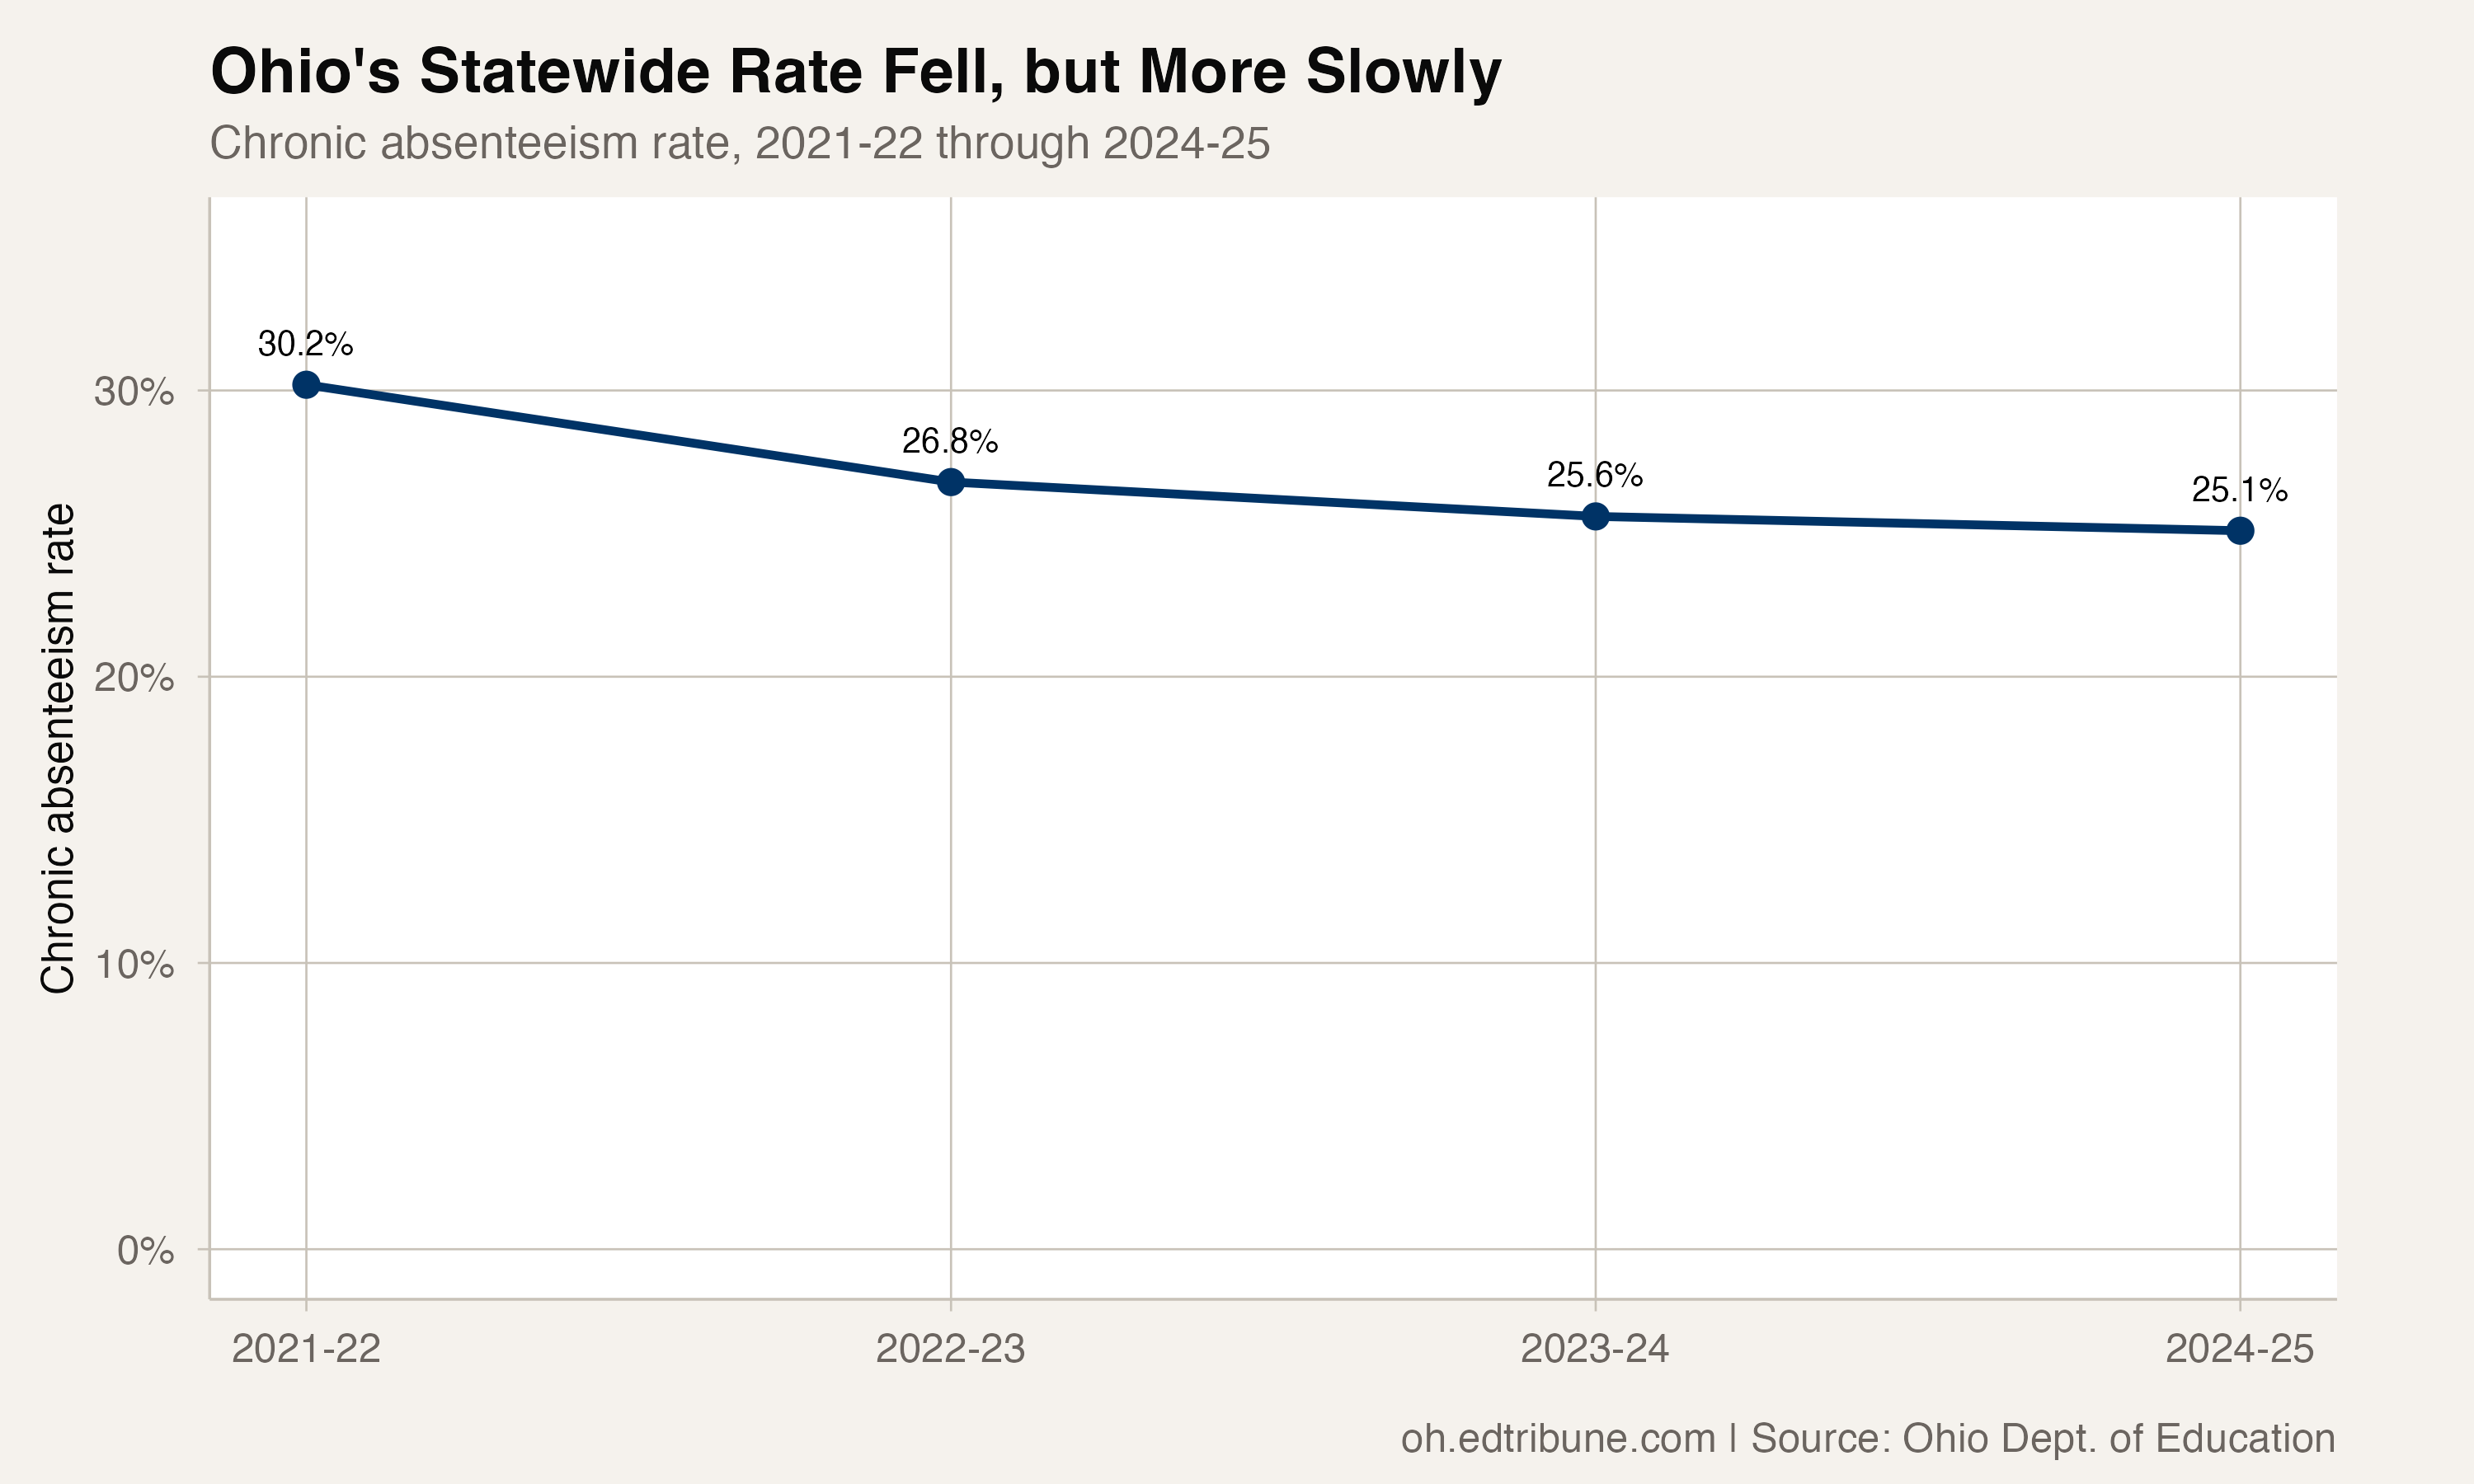
A smaller statewide decline
The latest statewide rate continued to move downward. But the half-point change in 2024-25 was smaller than either of the two preceding annual declines in the four-year panel.
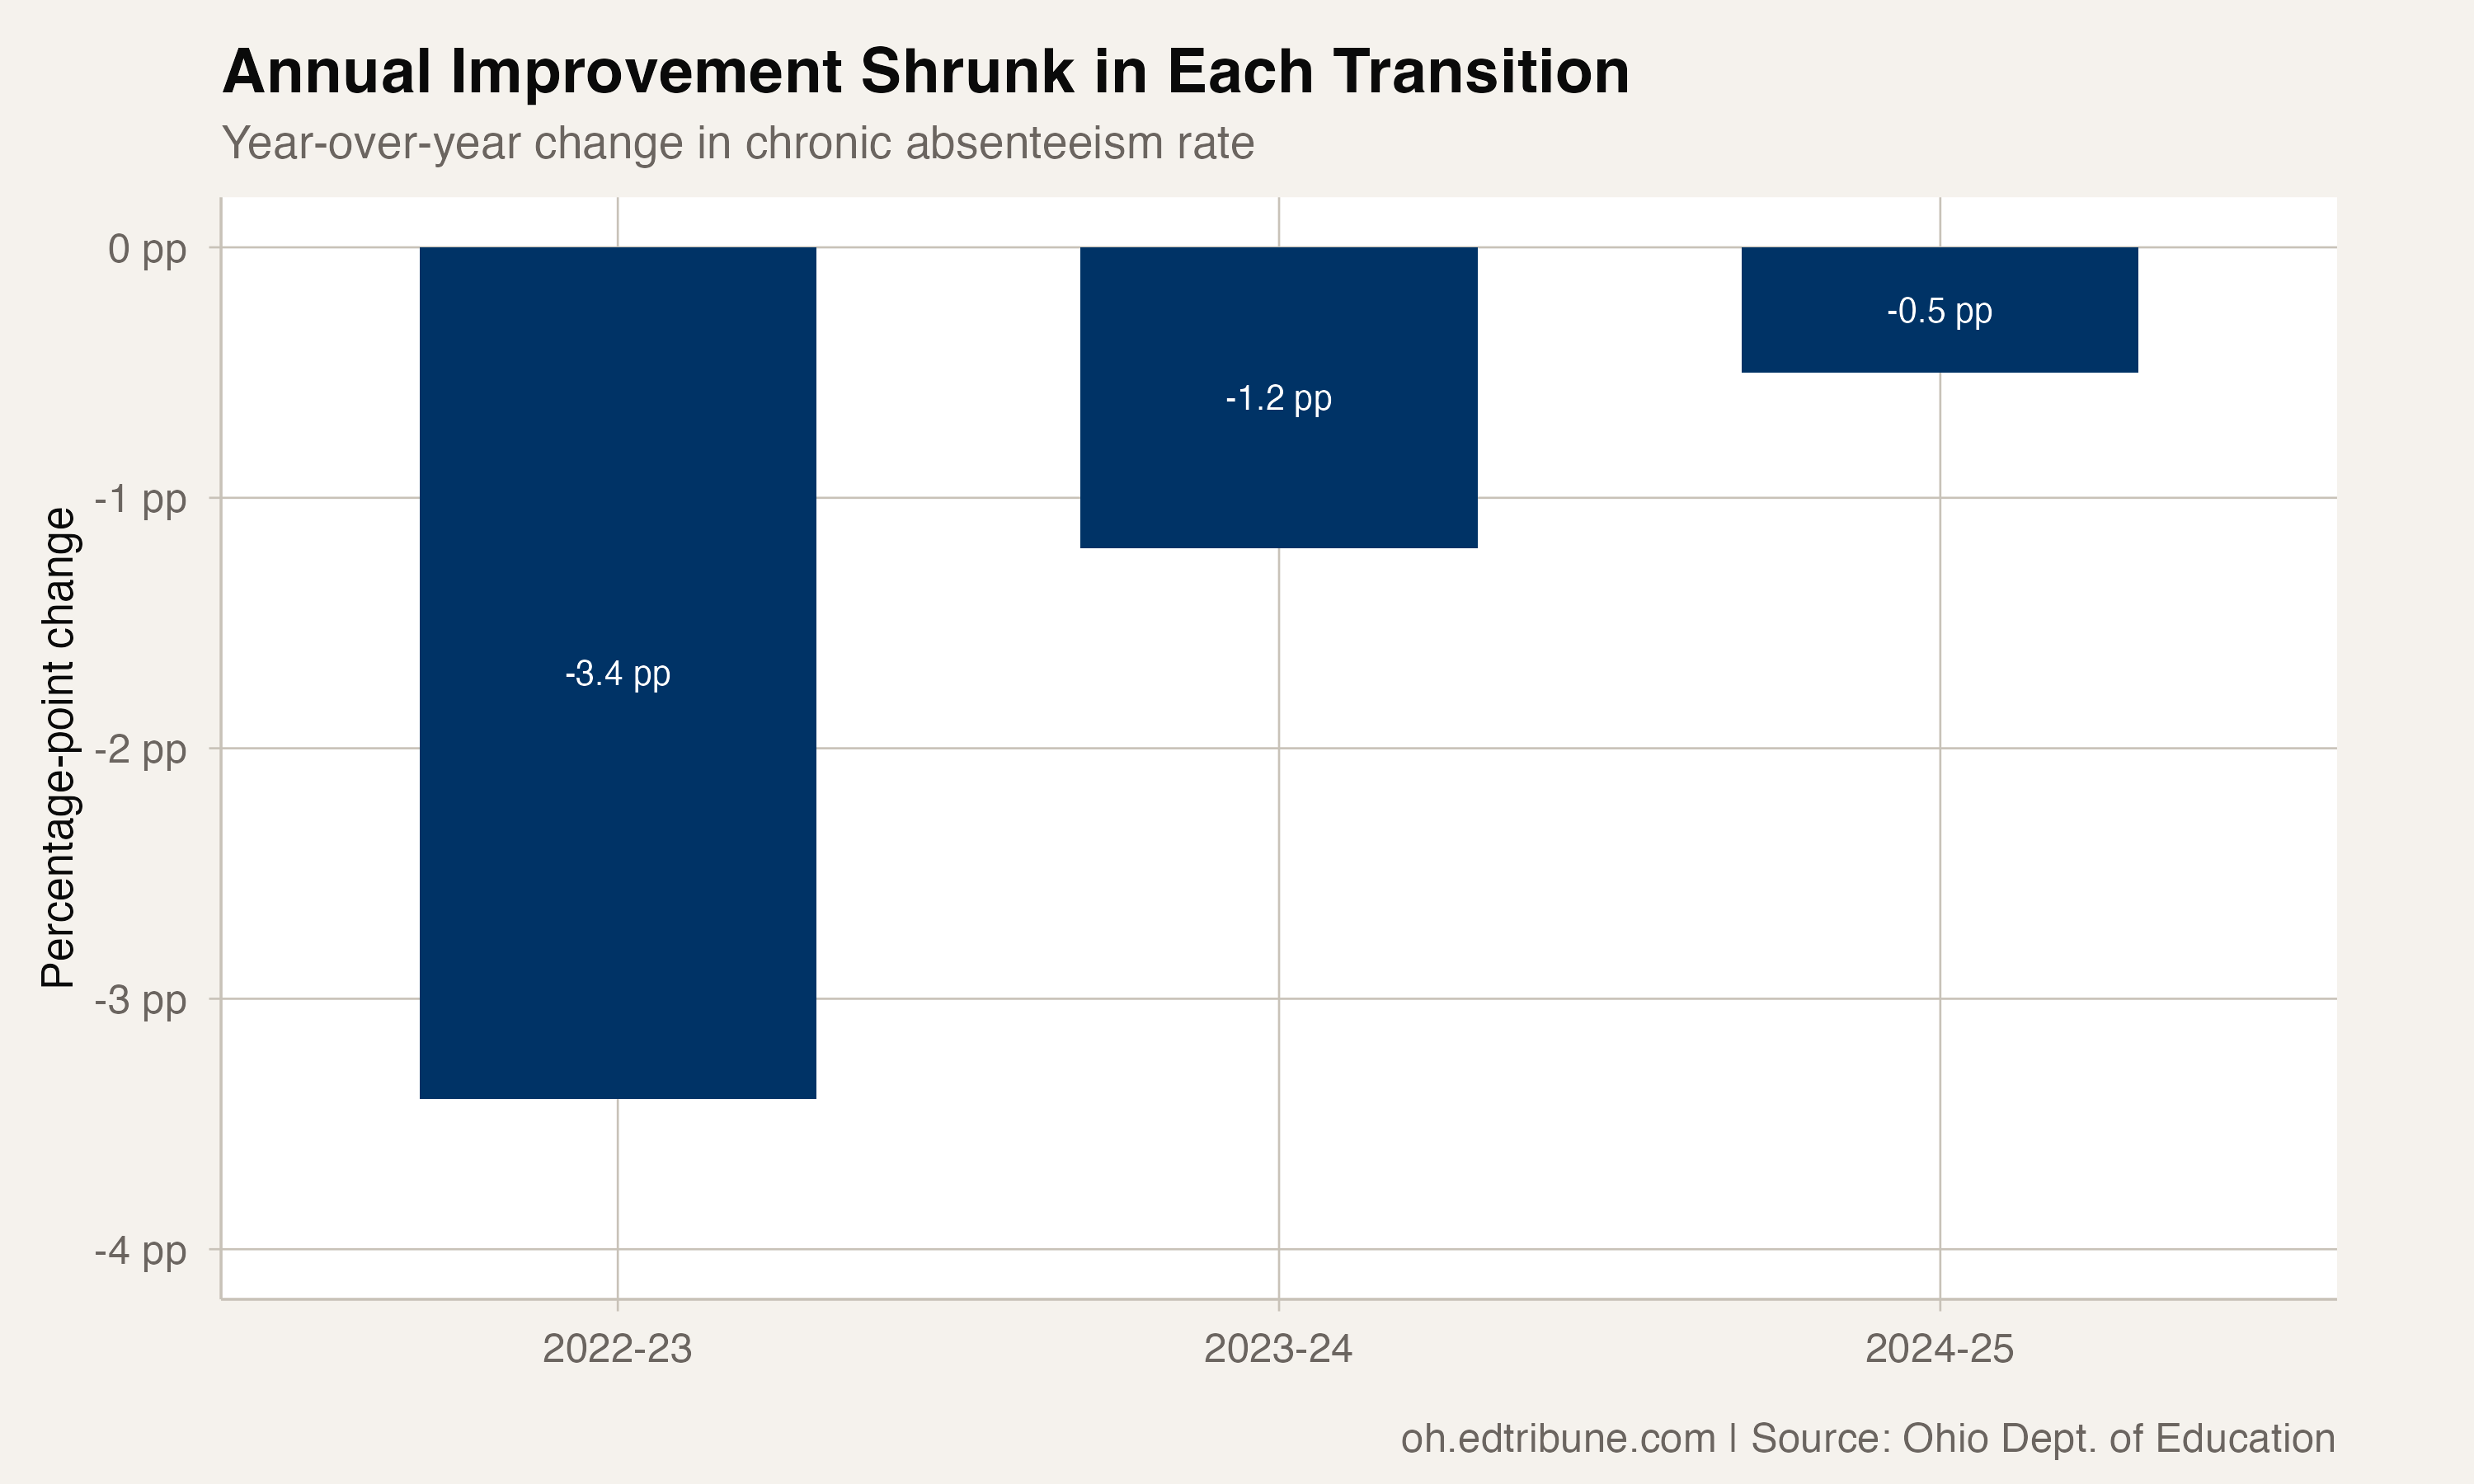
That pattern is what the data establish: three consecutive statewide improvements, each smaller than the one before it. The package output does not establish why the pace changed or what the next year will bring.
Subgroup rates remained far apart
Among the seven statewide rows selected for comparison, Black students had the highest 2024-25 chronic absenteeism rate at 42.9%. That was 23.8 percentage points above the 19.1% rate for white students, or 2.25 times as high.
Special education students had a 34.0% rate. The rates were 33.3% for economically disadvantaged students, 33.0% for Hispanic students, and 26.1% for English learners. The all-students state row was 25.1%.
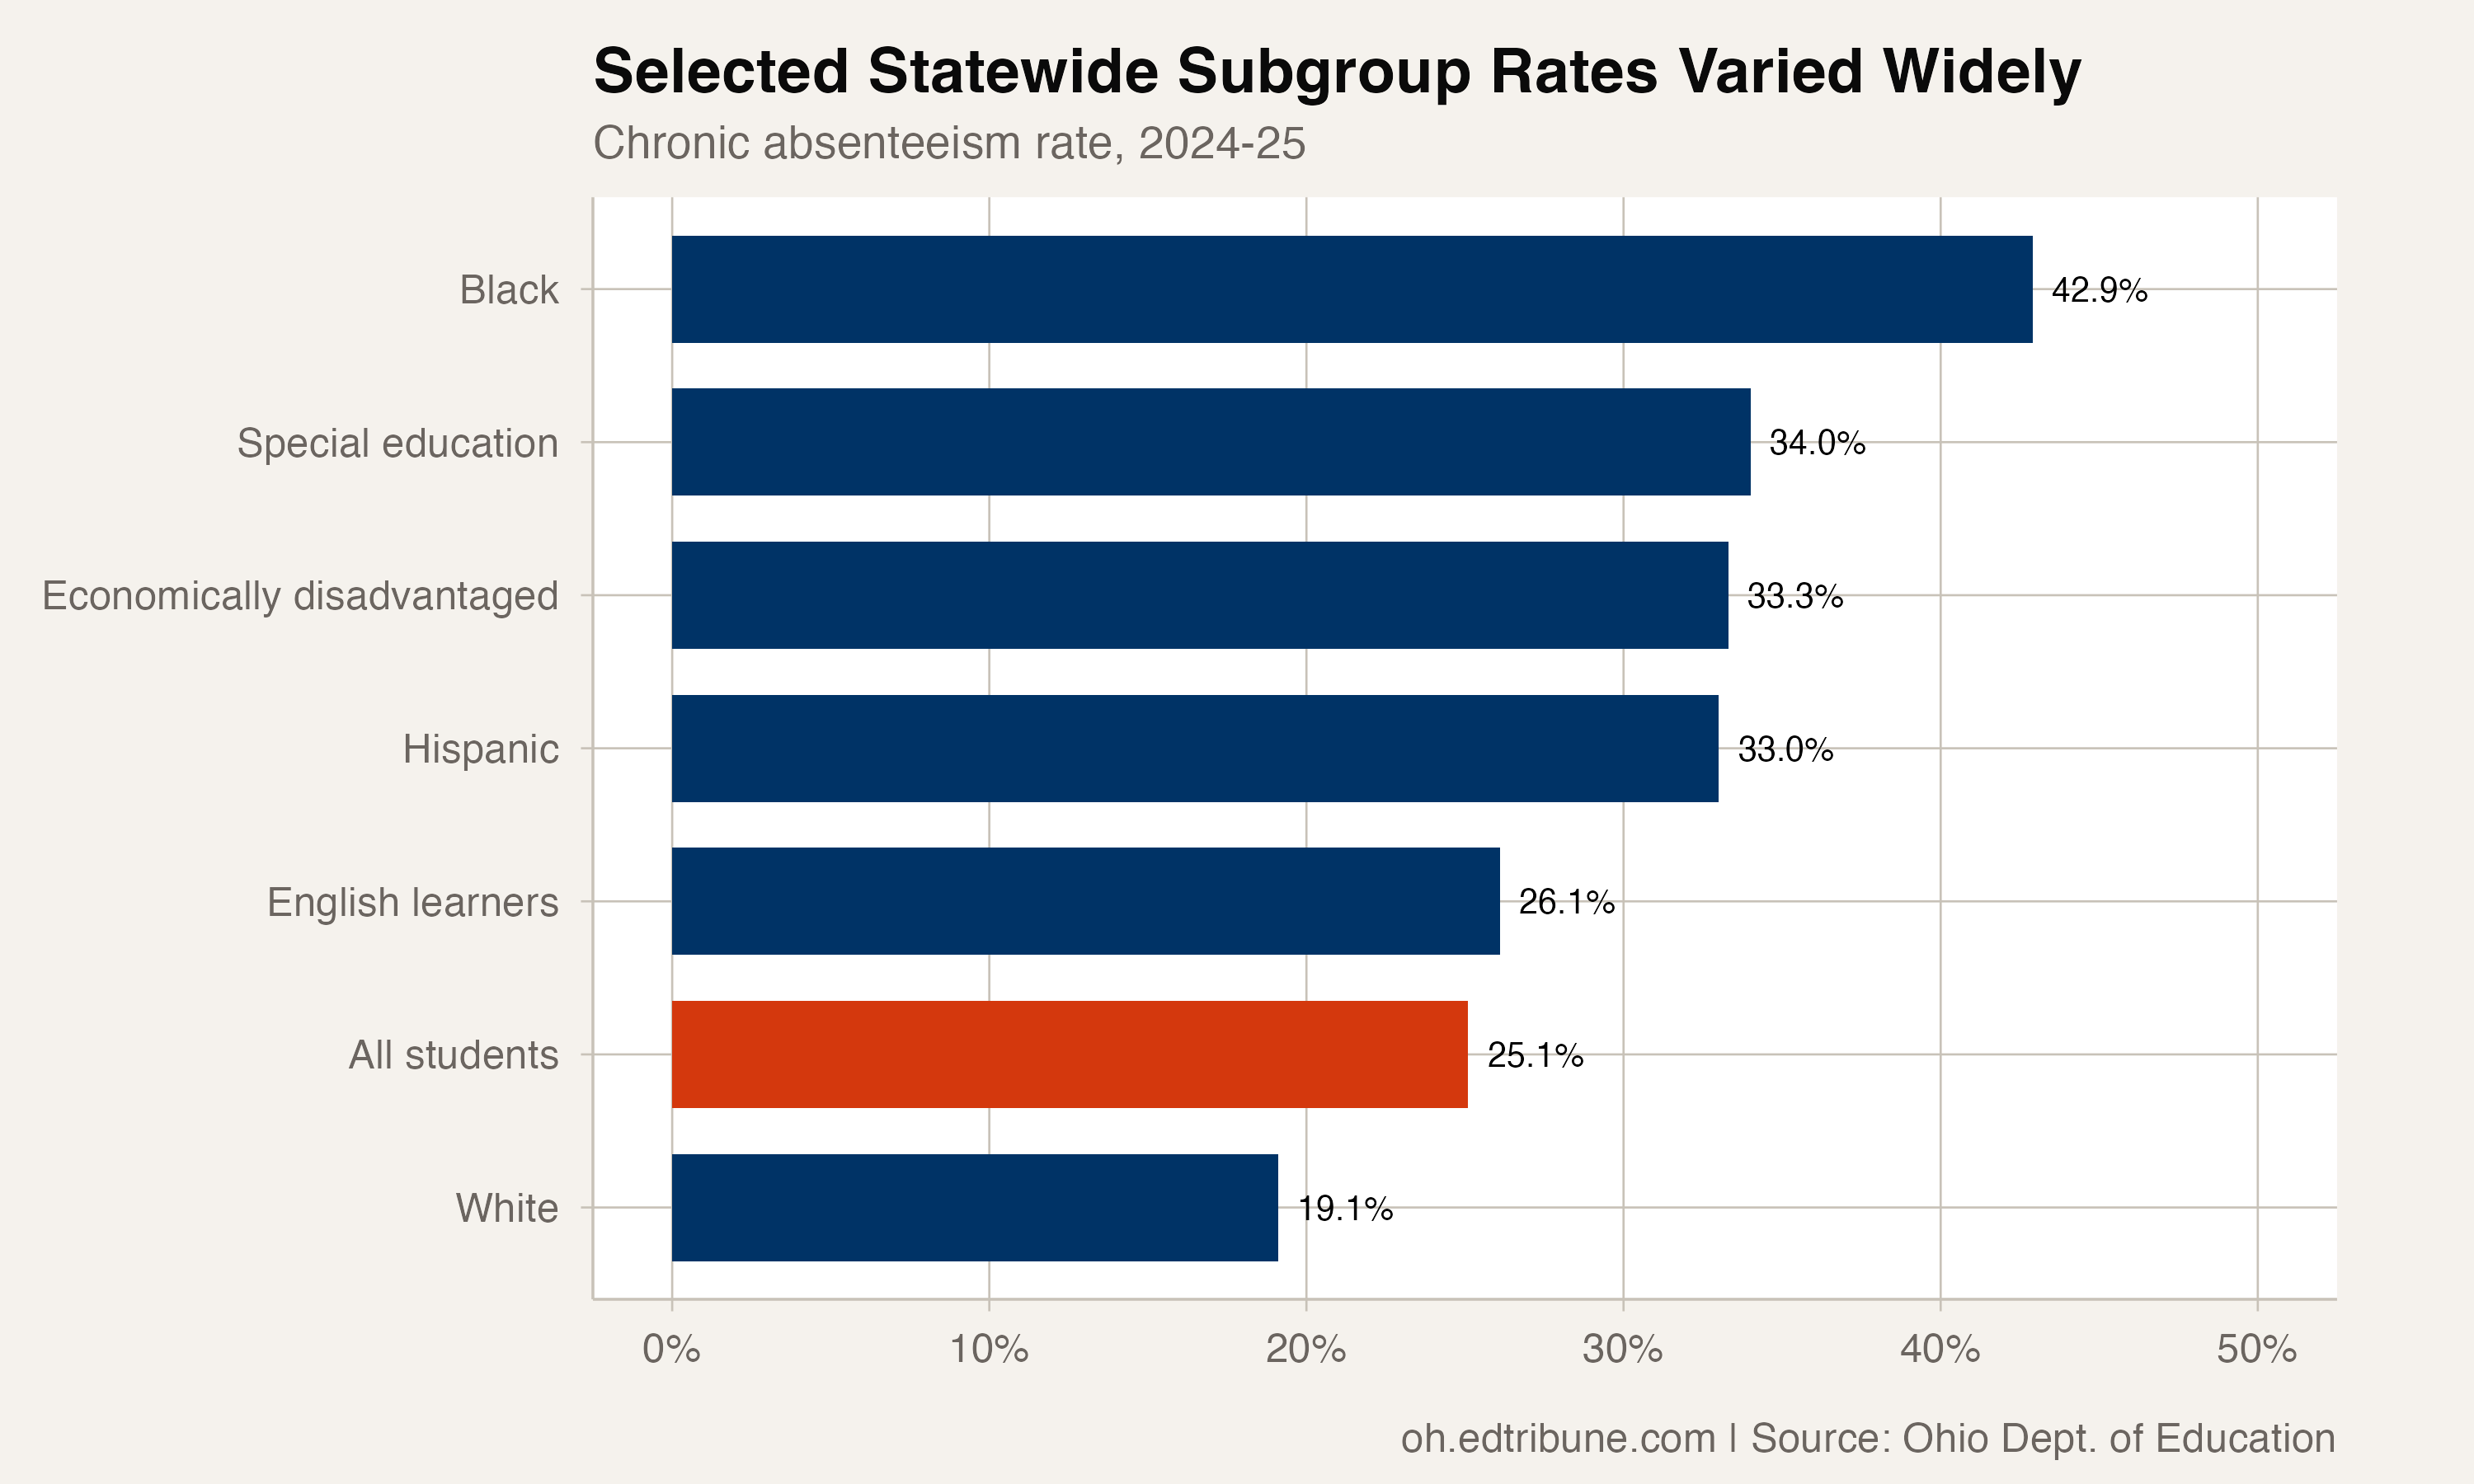
These are statewide subgroup rows reported by the package. They describe differences in the reported rates; they do not identify causes for those differences.
Two district comparisons tell different parts of the story
The longer endpoint comparison contains 600 districts with reported rates in both 2021-22 and 2024-25. Of those, 466 districts improved, 129 worsened, and five were unchanged. The improved group represented 77.7% of the matched panel.
The latest one-year comparison contains 604 districts with rates in both 2023-24 and 2024-25. In that panel, 363 districts improved, 224 worsened, and 17 were unchanged.
The two denominators matter. Ohio had 607 district rows with a reported 2024-25 rate, but not every current row had a usable value at each earlier endpoint. Treating all current rows as though they appeared in every comparison would overstate the matched sample.
Current district rates spanned nearly 58 points
Across those 607 current district rows, Miller City-New Cleveland Local reported the minimum rate at 1.3%, while Lorain City reported the maximum at 59.2%. The difference was 57.9 percentage points. Nine districts reported rates above 50%.
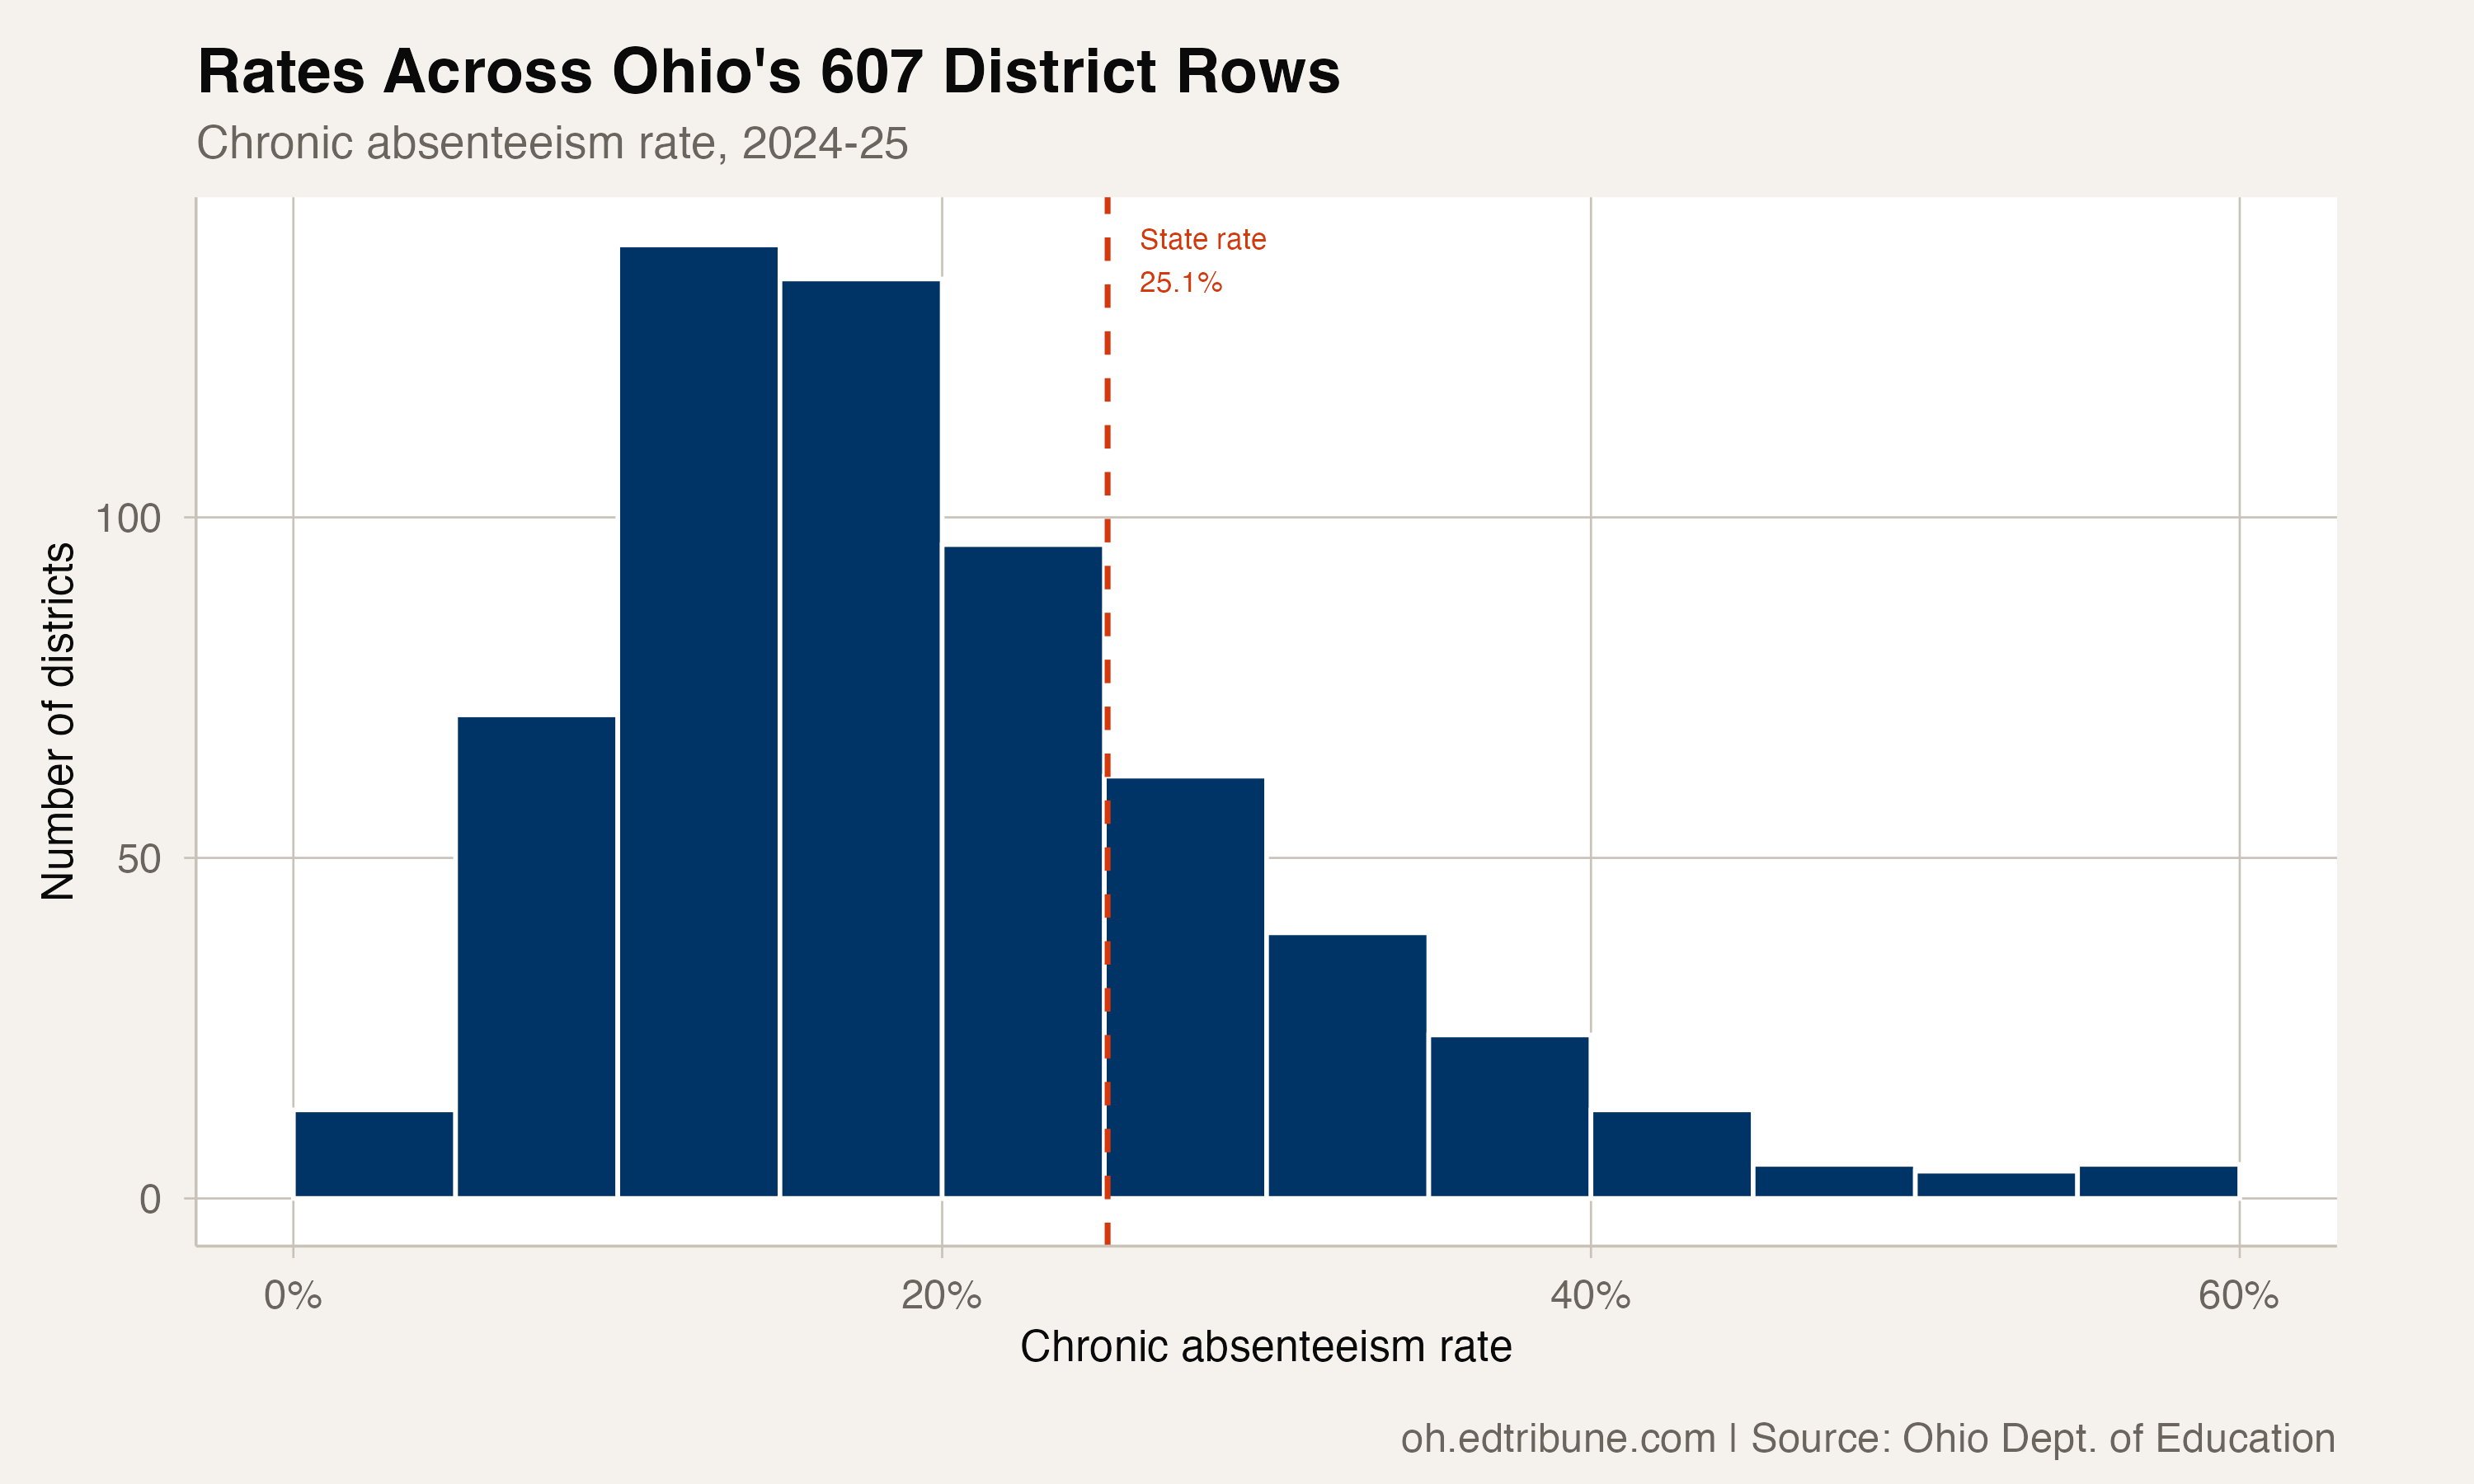
The histogram shows the statewide rate of 25.1% for reference, but that state row is not the unweighted average of district rates. It is the statewide value reported directly by Ohio's source data.
What the data verifies
This analysis drew on every available year of Ohio Department of Education and Workforce chronic-absence data, used authoritative state rows for statewide claims, and built explicit matched panels for district comparisons. The correction-only enrollment check also pulled the 2024-25 enrollment file and returned a 59.6% economically disadvantaged share.
The result is narrower than the earlier article but firmer: Ohio's statewide rate continued to decline through 2024-25, the annual improvement became smaller in each transition, and both subgroup and district results remained widely dispersed.
Detailed code that reproduces the analysis and figures in this article is available exclusively to EdTribune subscribers.
Discussion
Sign in to join the discussion.
Loading comments...