Correction (July 21, 2026): The earlier headline incorrectly equated a chronic-absence classification with being absent more often than present. The article also presented rate-times-enrollment estimates as reported student counts, gave an obsolete enrollment for North College Hill, and inferred threshold-group exits from the net change in two statewide counts. This version corrects those points and rebuilds every claim and chart from executed Ohio package output.
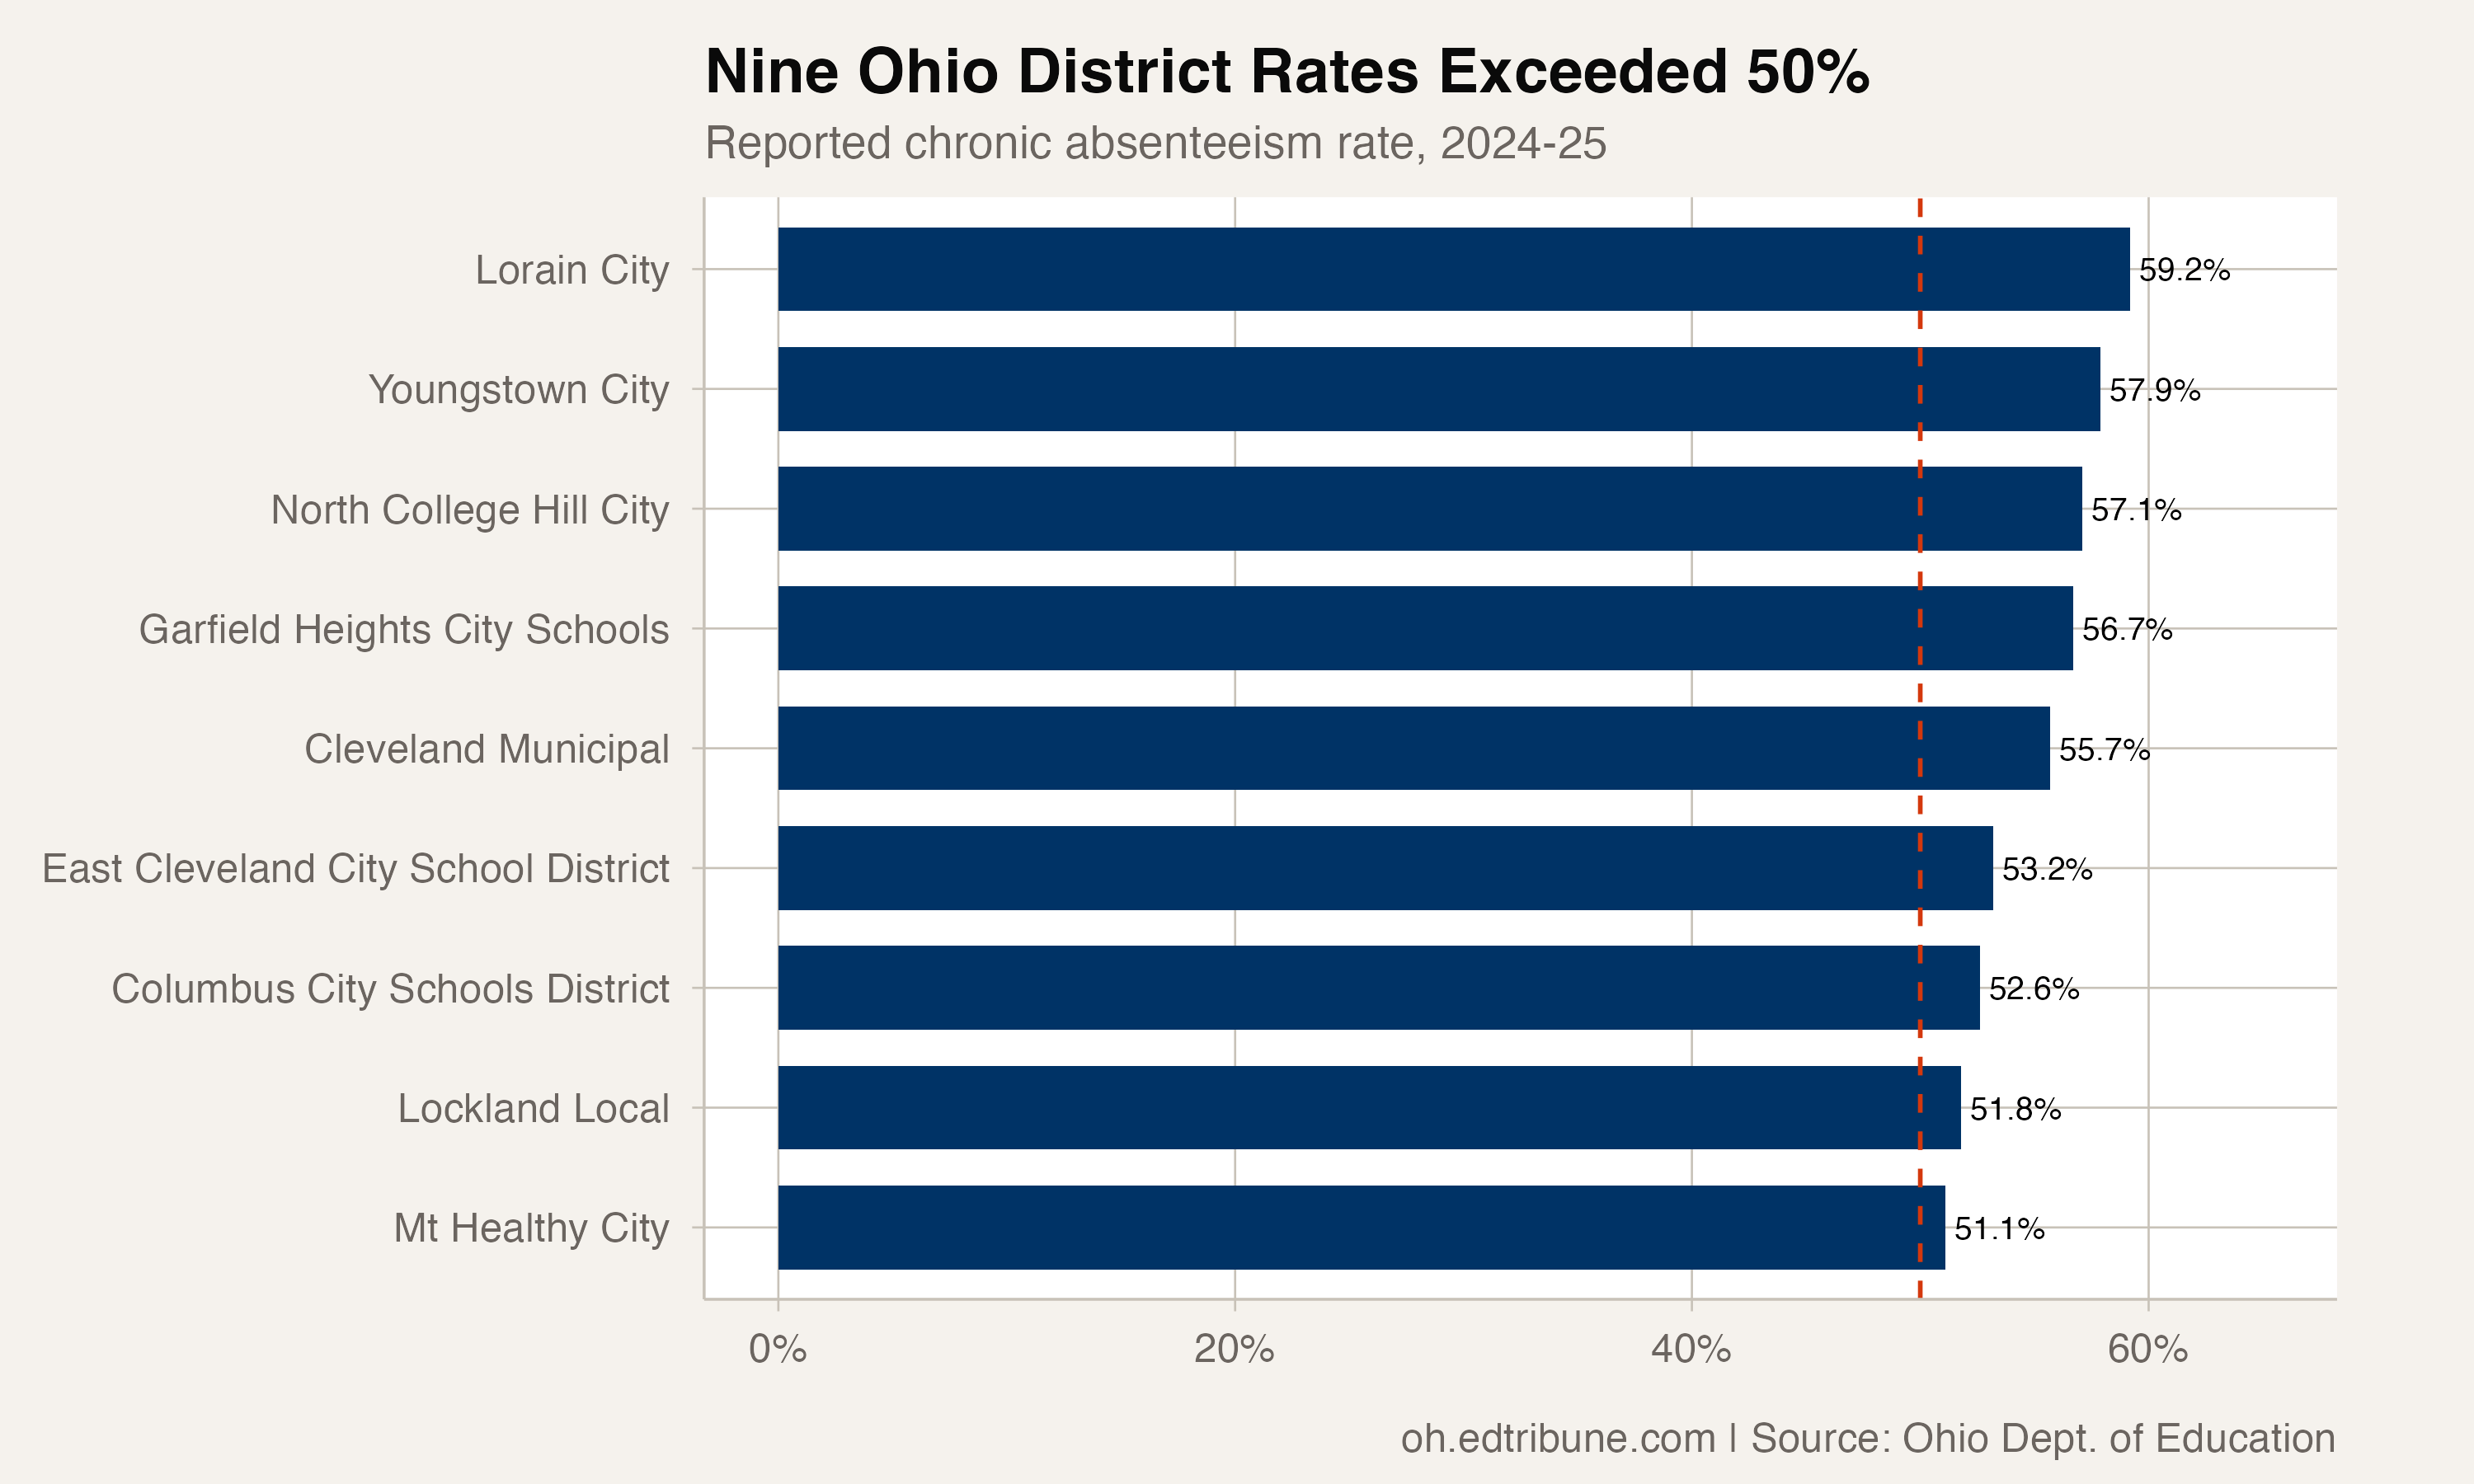
Nine Ohio district rows reported 2024-25 chronic absenteeism rates above 50%. That means more than half of enrolled students were classified as chronically absent; it does not mean those students were absent on more days than they were present.
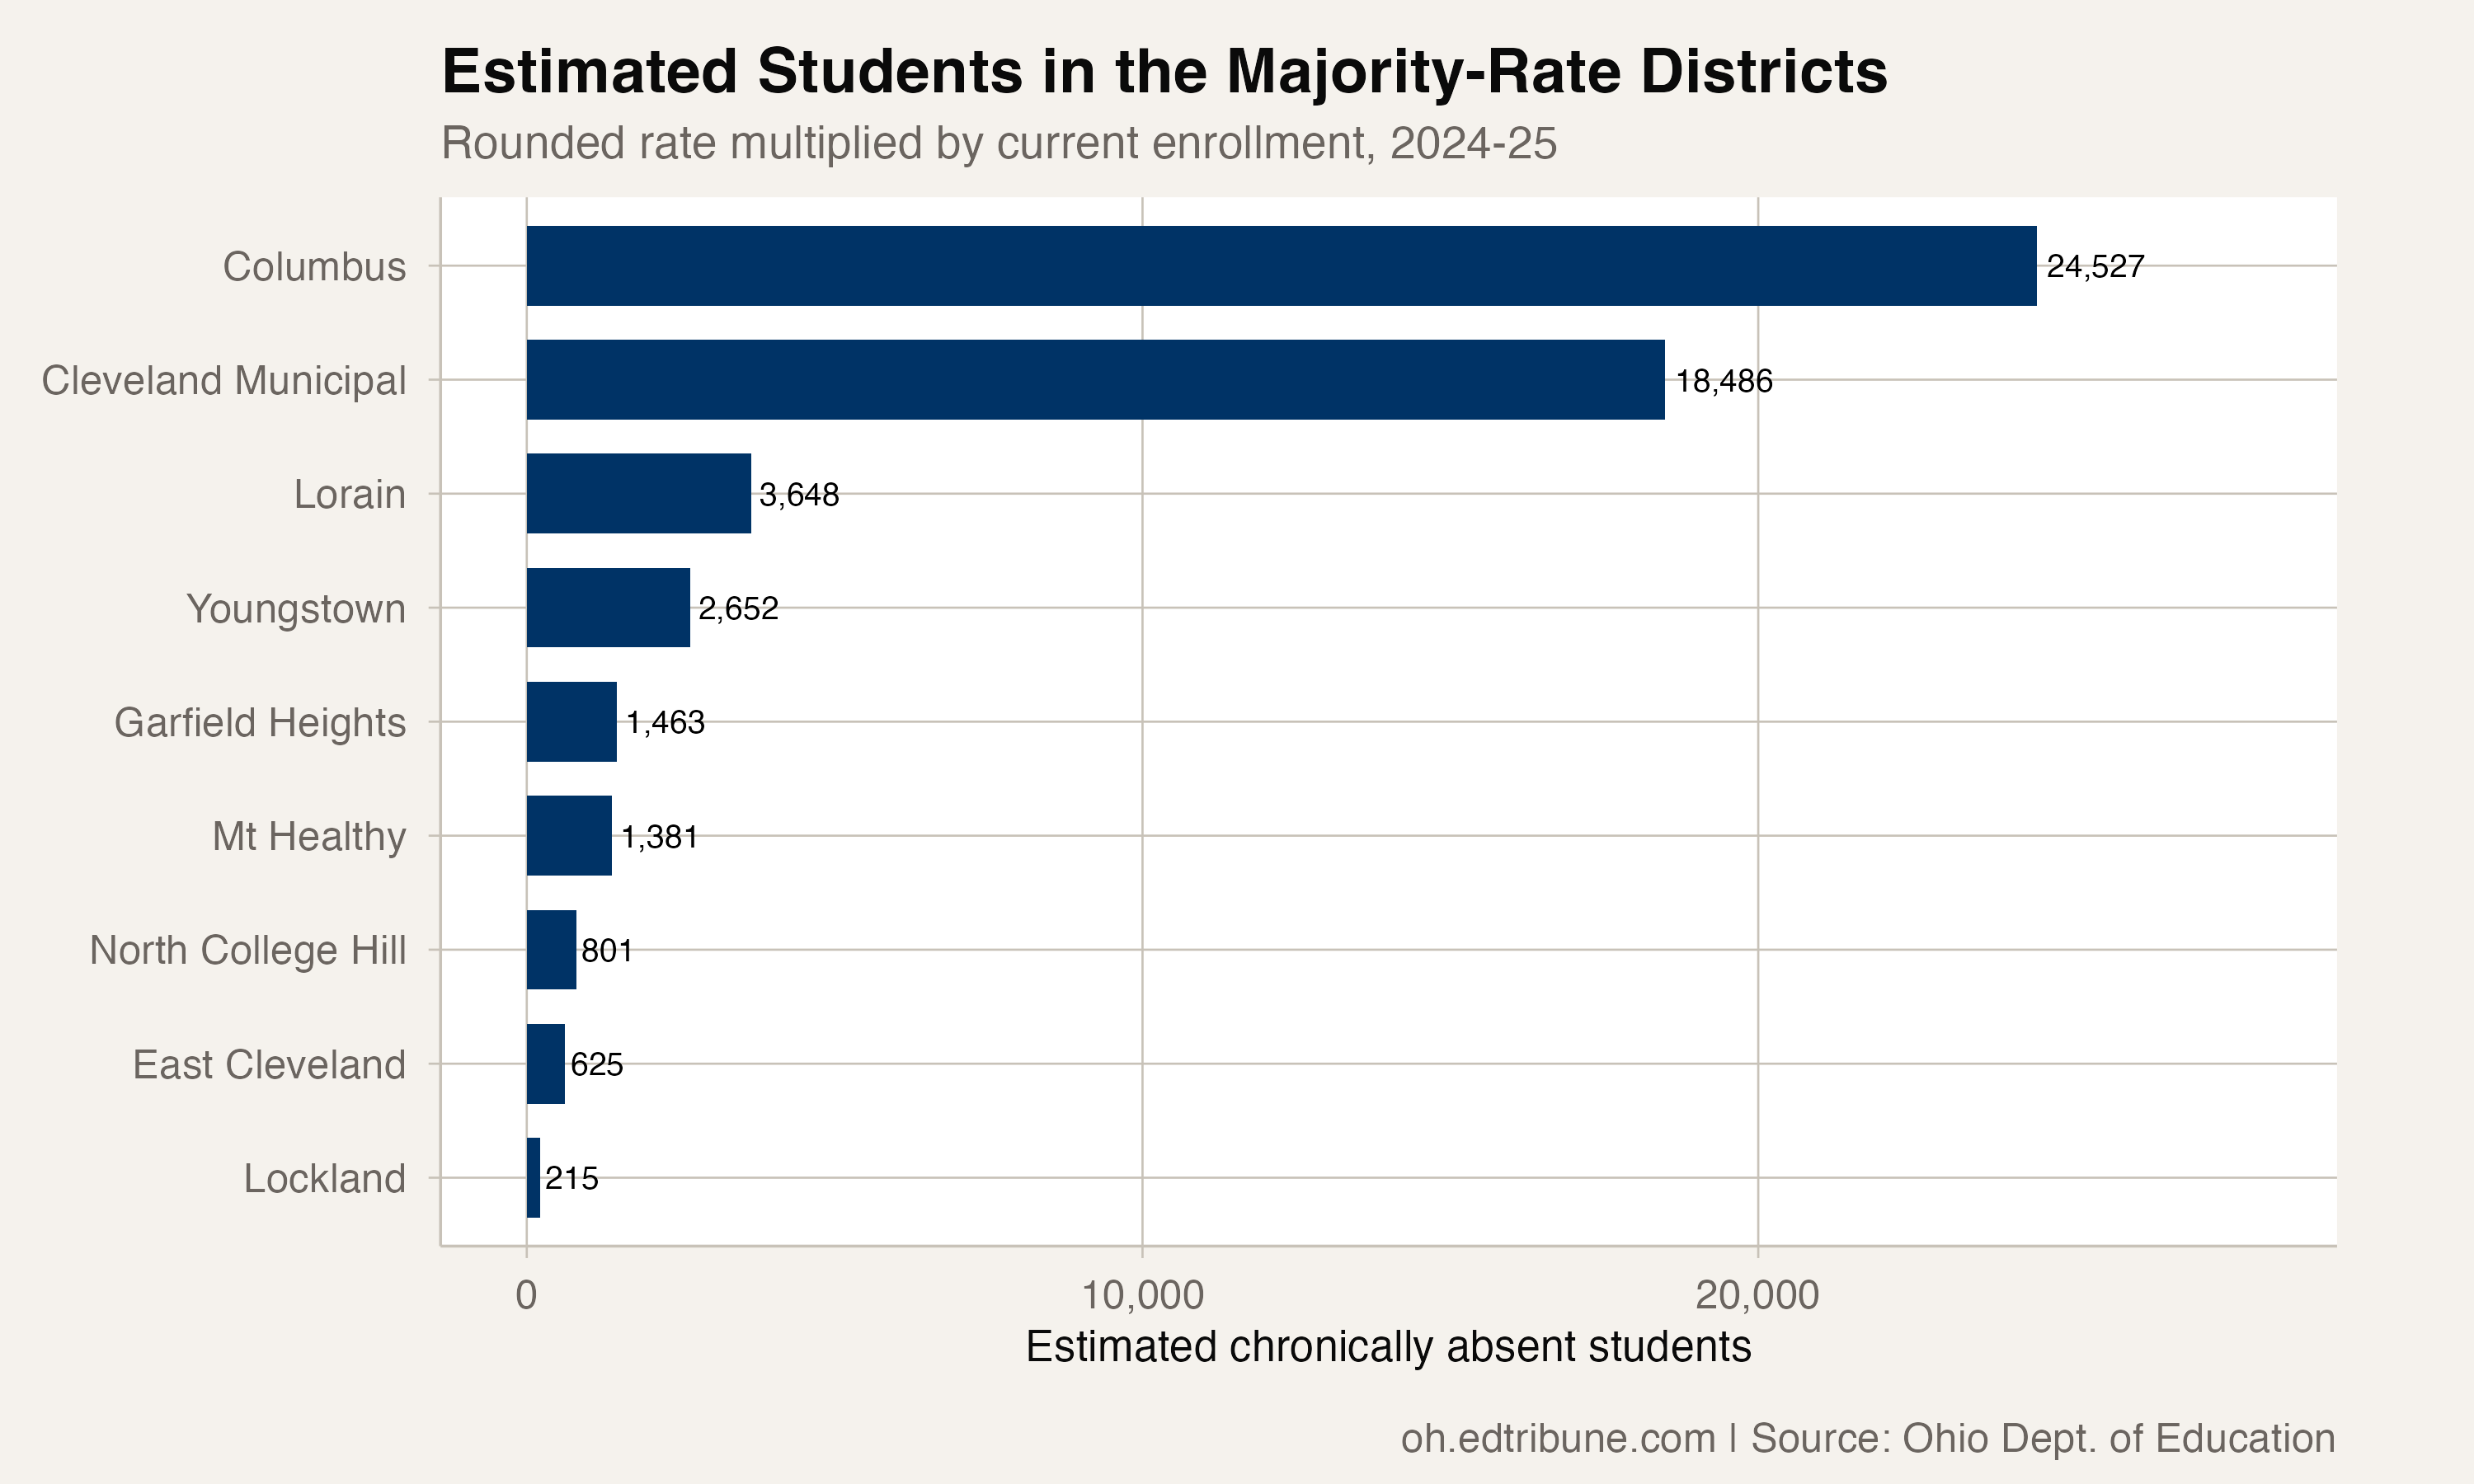
The nine districts enrolled 98,836 students in the current enrollment pull. Multiplying each district's rounded published rate by its enrollment produces an estimated 53,798 chronically absent students. Those are derived estimates, not student counts reported directly in the absence file.
The nine current district rows
Lorain City↗ET had the highest reported rate at 59.2%. Its enrollment was 6,162, yielding an estimated 3,648 chronically absent students.
Youngstown City↗ET reported 57.9% among 4,580 students, an estimated 2,652. North College Hill City↗ET reported 57.1% among 1,402 students, an estimated 801. The earlier article incorrectly used an enrollment of 1,299 for North College Hill.
Garfield Heights City Schools↗ET reported 56.7% among 2,580 students, an estimated 1,463. Cleveland Municipal↗ET reported 55.7% among 33,189 students, an estimated 18,486.
East Cleveland City School District↗ET reported 53.2% among 1,175 students, an estimated 625. Columbus City Schools District↗ET reported 52.6% among 46,630 students, an estimated 24,527.
Lockland Local↗ET reported 51.8% among 415 students, an estimated 215. Mt Healthy City↗ET reported 51.1% among 2,703 students, an estimated 1,381.
The count fell, but membership changed
The package reported 21 district rates above 50% in 2021-22 and nine in 2024-25, a net decline of 12 districts. The two groups were not the same: seven districts appeared above the threshold in both years, 14 of the earlier districts moved out of the group, and two current districts entered it.
That membership test corrects the earlier claim that exactly 12 of the original districts had moved below the threshold. A net change alone cannot establish which districts entered or exited.
Four trajectories
Youngstown's rate fell in each transition, from 70.0% in 2021-22 to 59.3%, 58.6%, and 57.9%. Its endpoint change was a decline of 12.1 percentage points.
Lorain fell from 64.5% to 59.0%, rose to 60.1%, and then fell to 59.2%. Its endpoint decline was 5.3 points.
North College Hill moved in the opposite direction: 40.3%, 46.0%, 52.0%, and 57.1%. Its endpoint increase was 16.8 points. Cleveland fell from 62.3% to 56.1% and 51.5%, then rose to 55.7% in 2024-25.
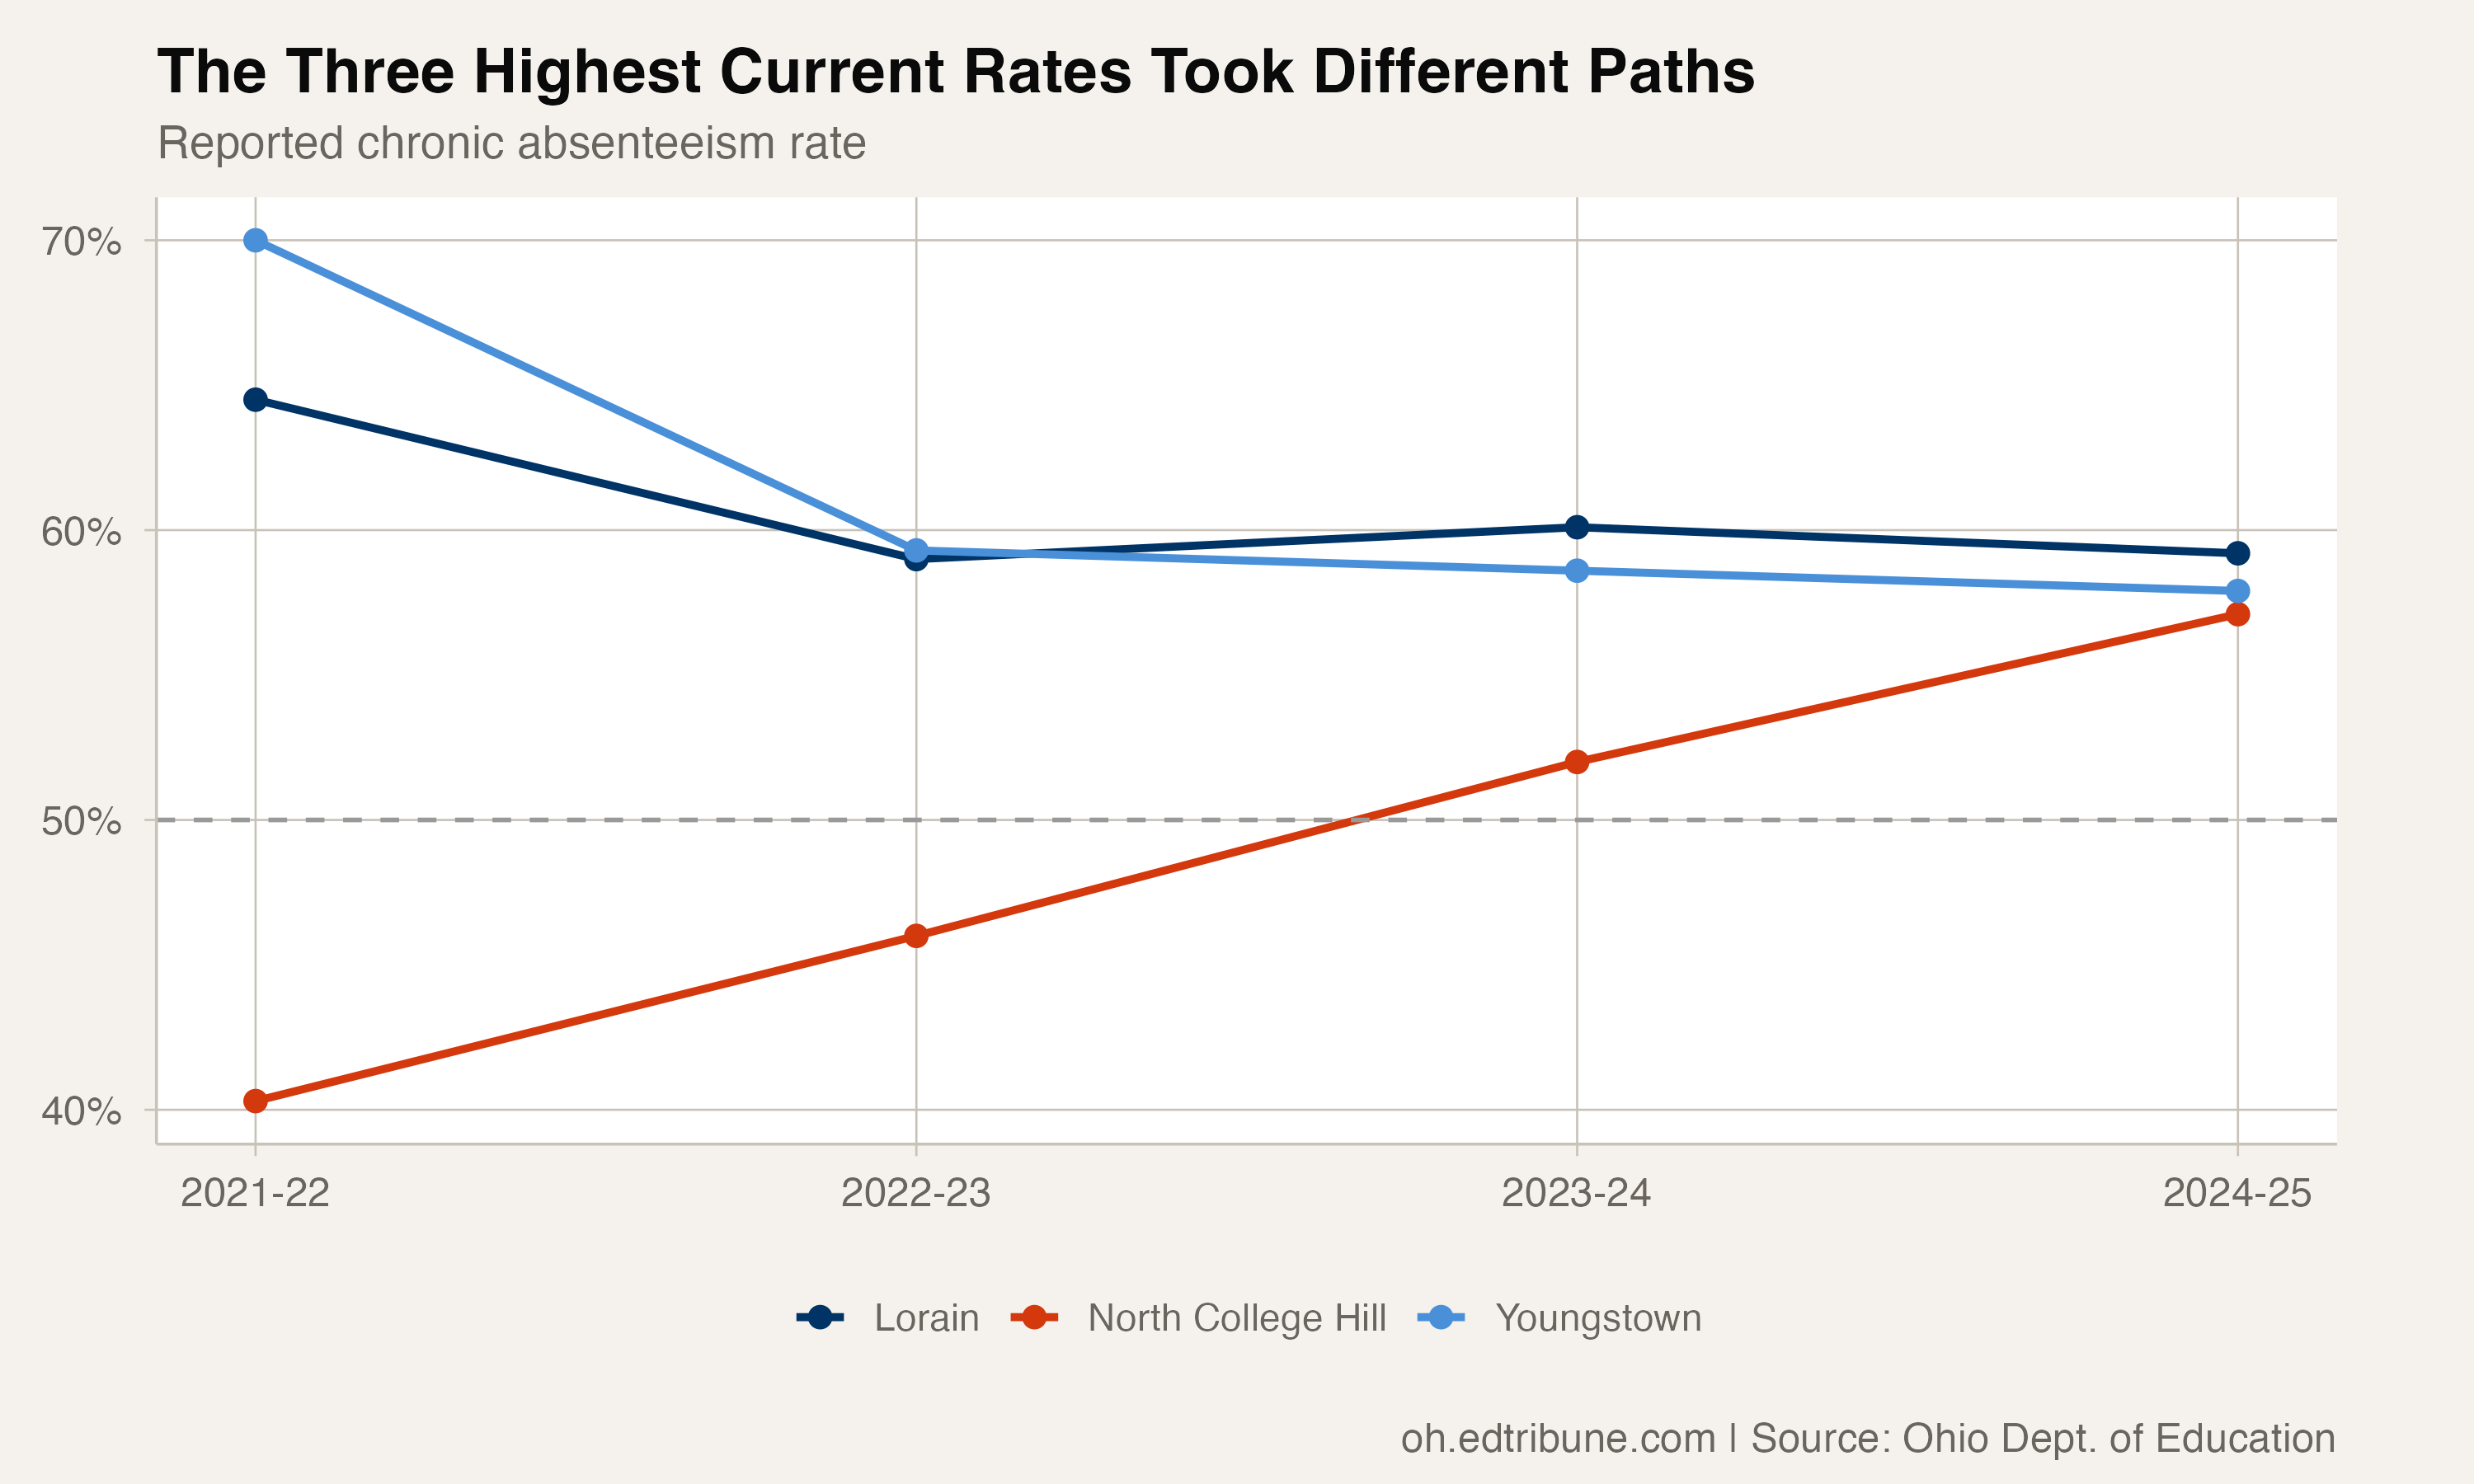
The statewide rate fell from 30.2% to 25.1% across the same endpoints, a 5.1-point decline. These four district paths show why the statewide change does not describe every local trajectory.
The scale of the two largest estimates
Columbus and Cleveland together accounted for an estimated 43,013 chronically absent students: 24,527 in Columbus and 18,486 in Cleveland. The Columbus estimate alone exceeded the total enrollment of 604 of the 607 current district rows and equaled 1.4% of Ohio's statewide enrollment of 1,738,440.
Those comparisons describe scale, not causation or a forecast. The auditable result is that nine current district rates exceeded 50%, their combined derived estimate was 53,798 students, and membership in that threshold group changed substantially since 2021-22.
Detailed code that reproduces the analysis and figures in this article is available exclusively to EdTribune subscribers.
Discussion
Sign in to join the discussion.
Loading comments...