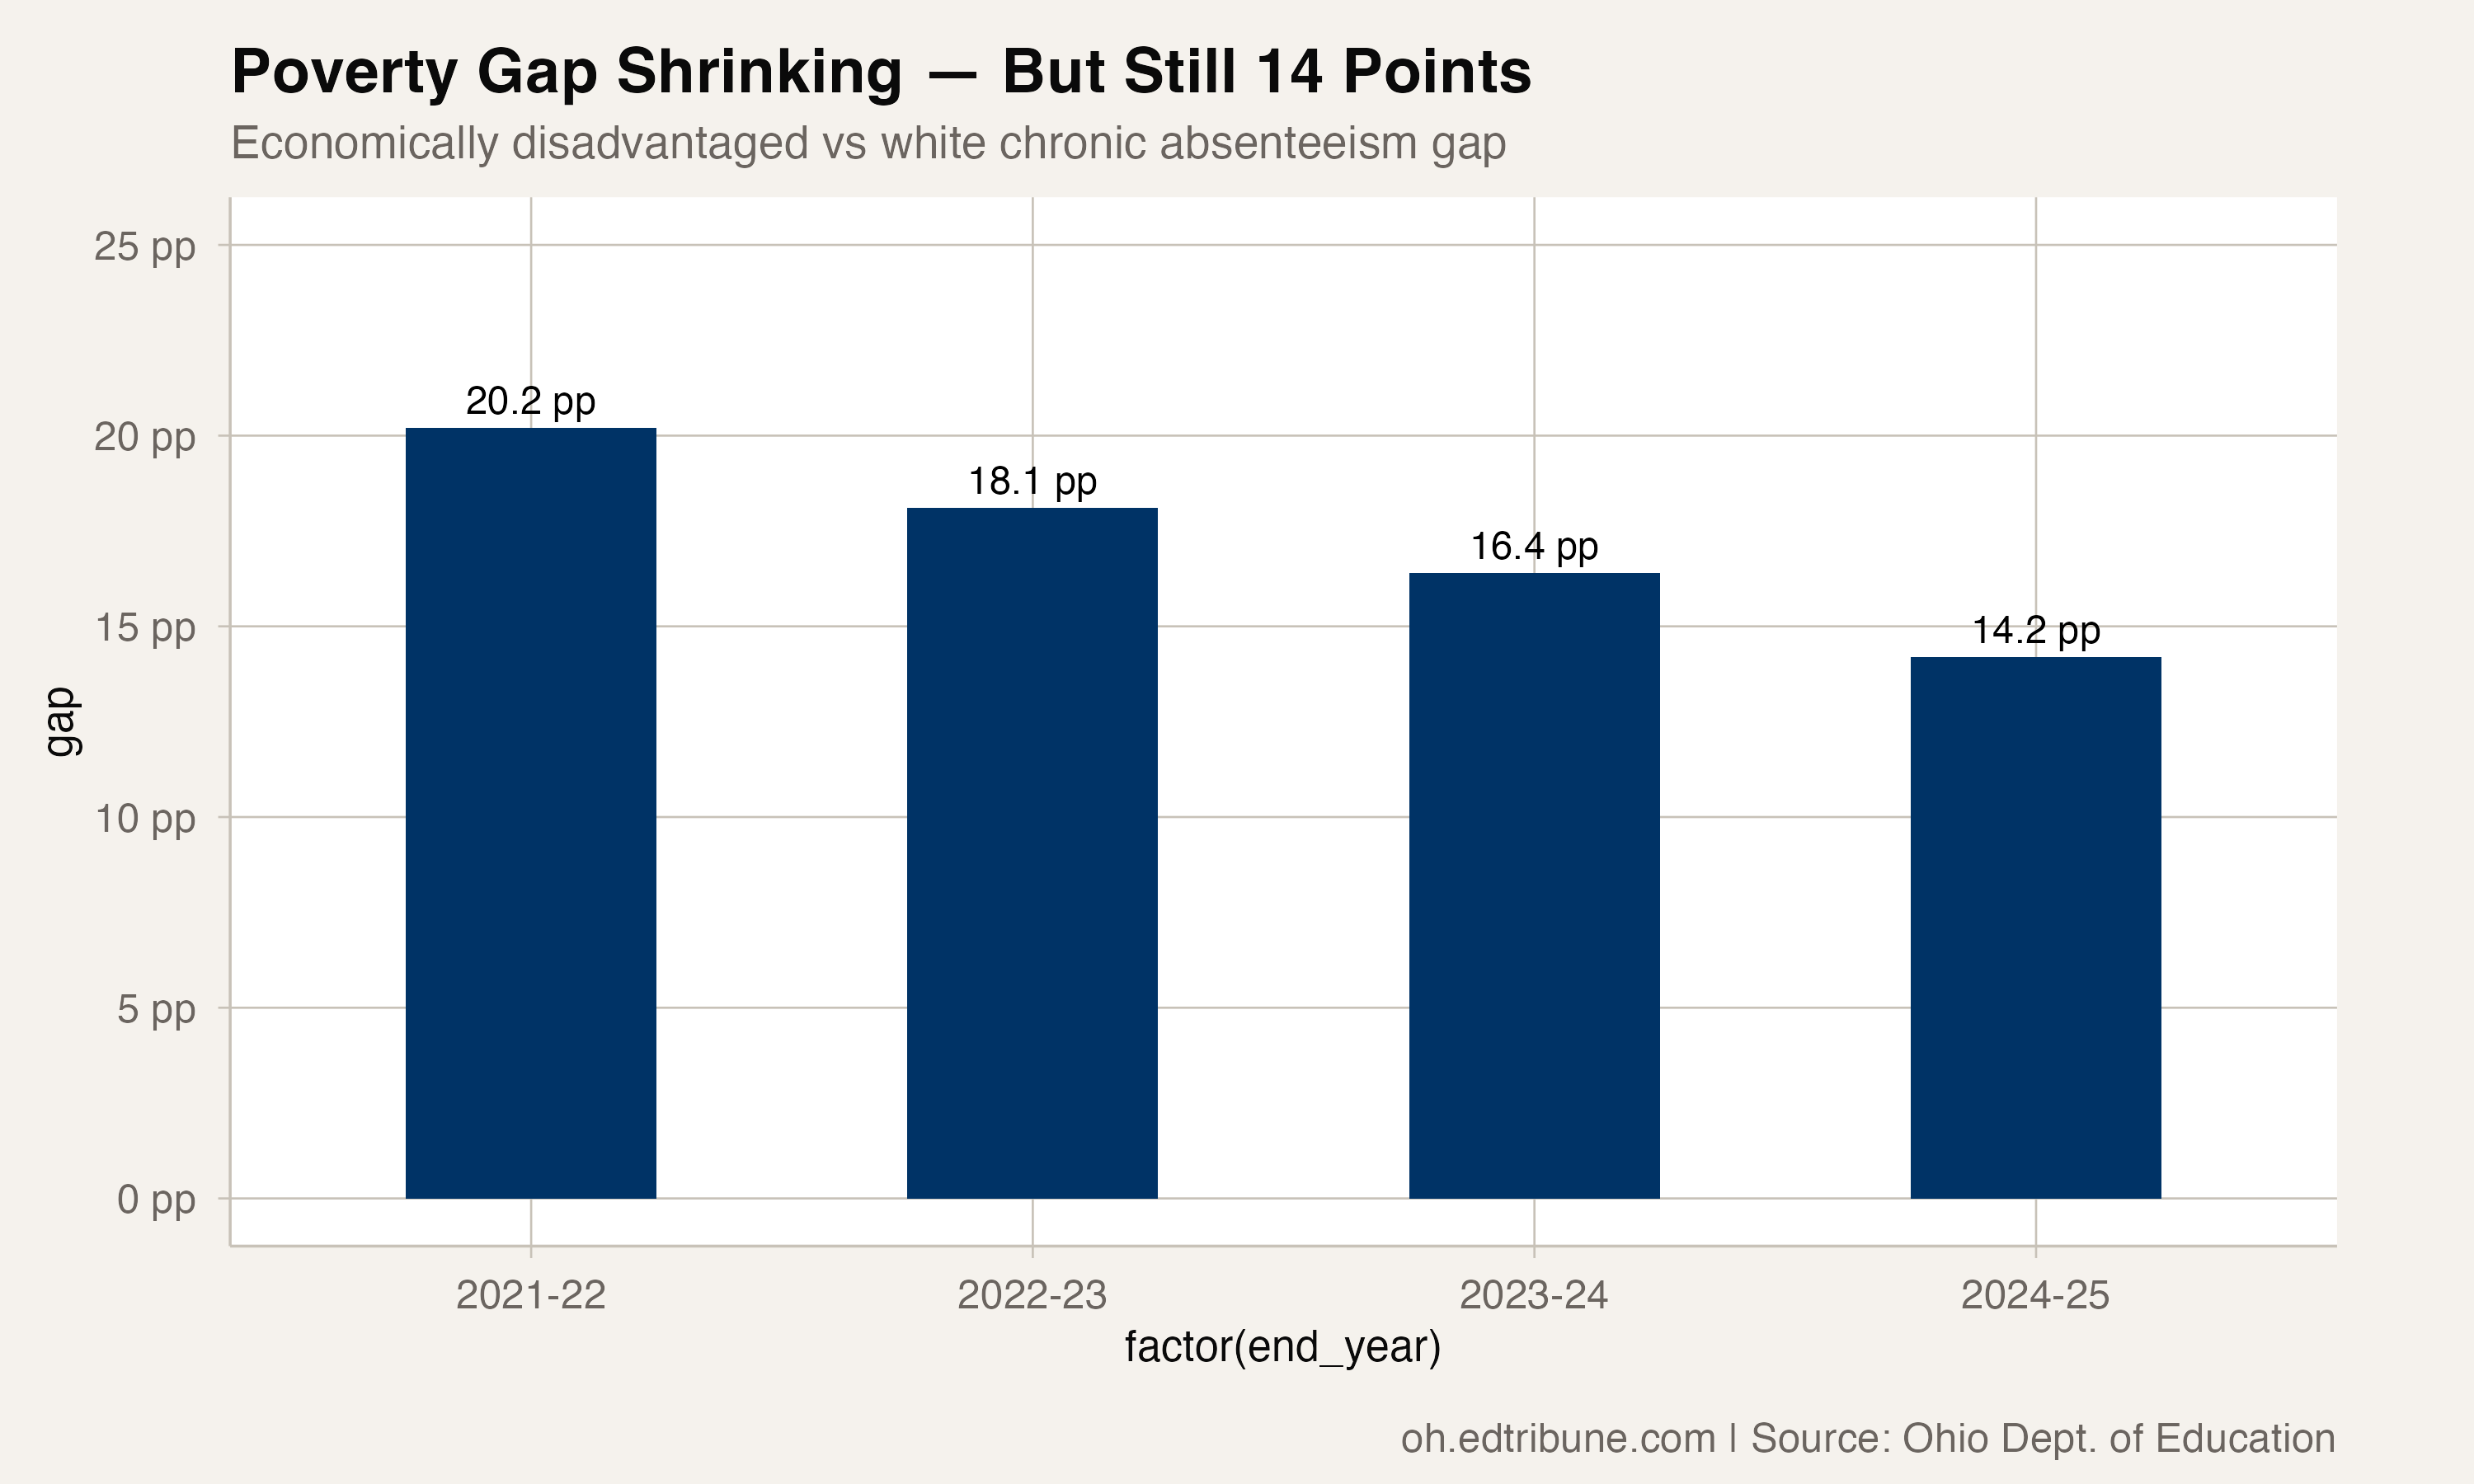
Ohio's chronic absenteeism gap between economically disadvantaged and white students narrowed by 6.0 percentage points from 2021-22 to 2024-25. The gap fell from 20.2 points to 14.2.
Direct evidence: The statewide rates come from Ohio's published chronic-absence rows for the economically disadvantaged and white subgroups. The source package labels the former free_reduced_lunch; this article uses Ohio's economically disadvantaged label.
The complication is what those numbers actually mean.
Improvement on Both Sides — Unequally
Economically disadvantaged students improved from 44.4% to 33.3% — an 11.1-point drop. White students improved from 24.2% to 19.1%, a 5.1-point drop. The gap narrowed because the economically disadvantaged rate fell faster in percentage-point terms.
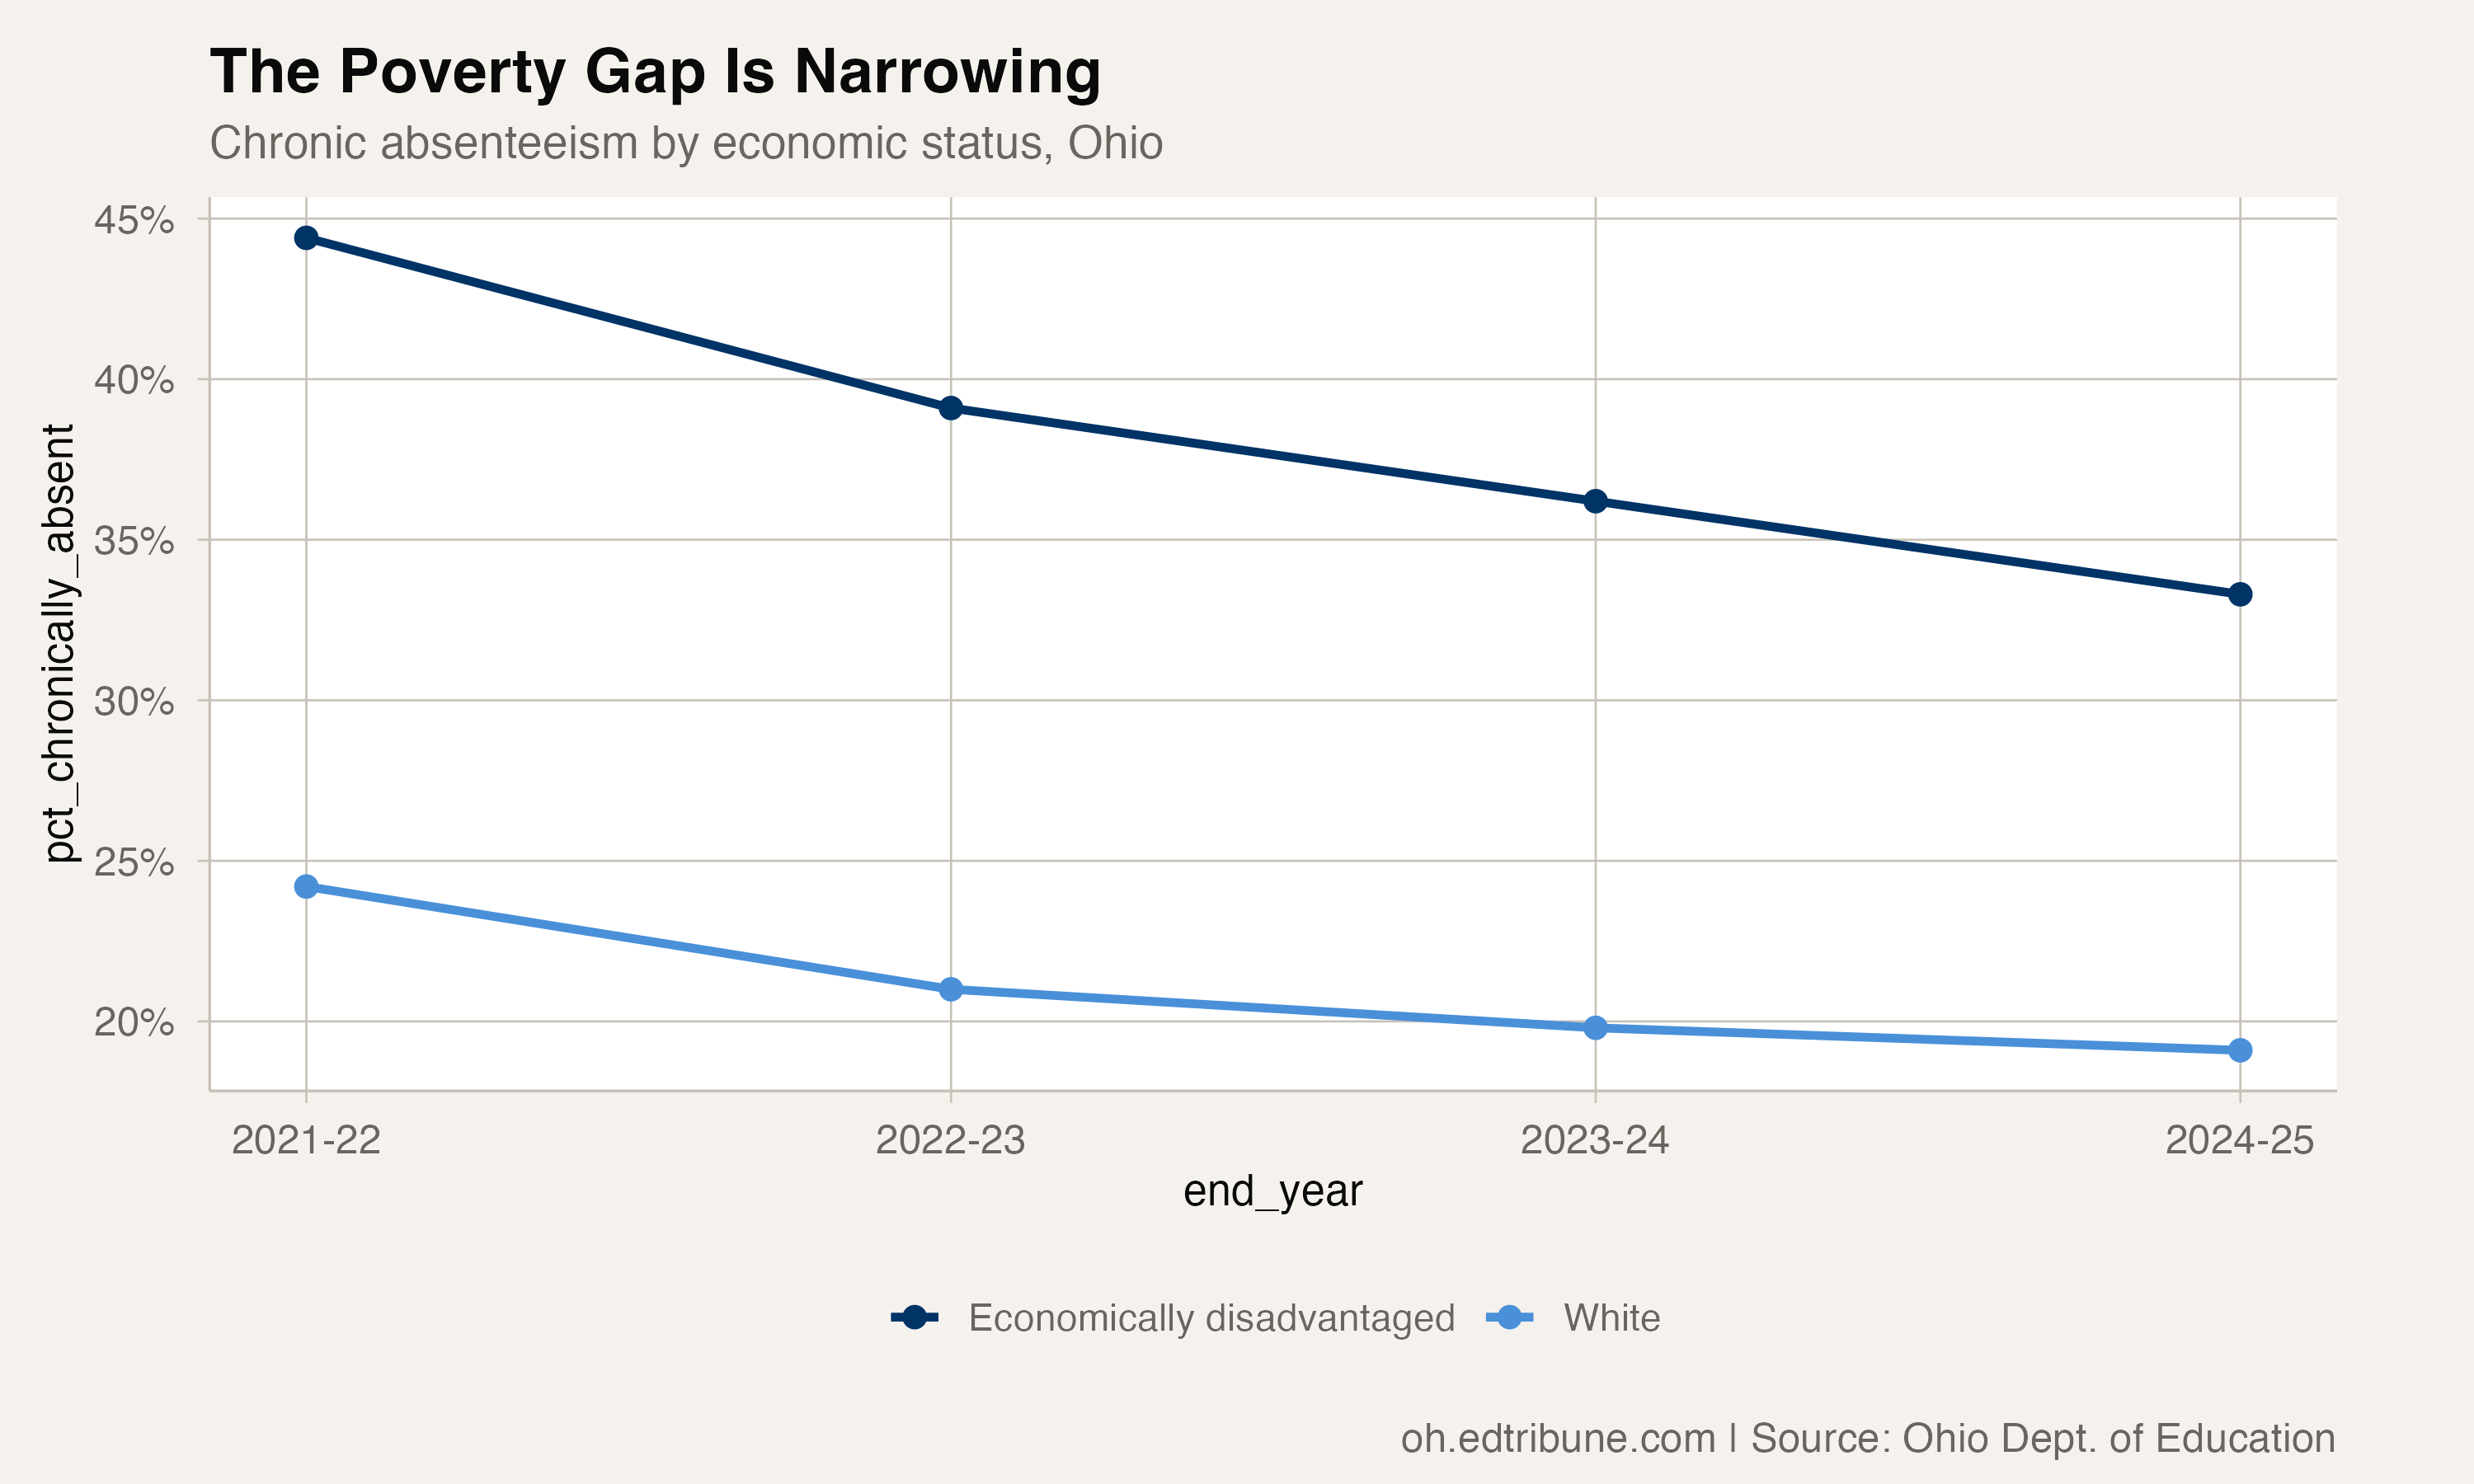
The 33.3% 2024-25 rate remains high even after the improvement.
The subgroup's composition changed
The subgroup's size also changed. In 2021-22, the published economically disadvantaged enrollment was 46.6% of the statewide total. By 2024-25, it was 62.1%: 1,025,598 of 1,652,539 students.
That change means the rates describe the published subgroup in each year; they do not track an identical group of students. The rate comparison is direct evidence of the reported series, while the composition change is a reason to avoid treating it as a count of the same population.
The Improvement Hierarchy
Among the subgroup comparisons shown here, the economically disadvantaged rate had the largest percentage-point improvement:
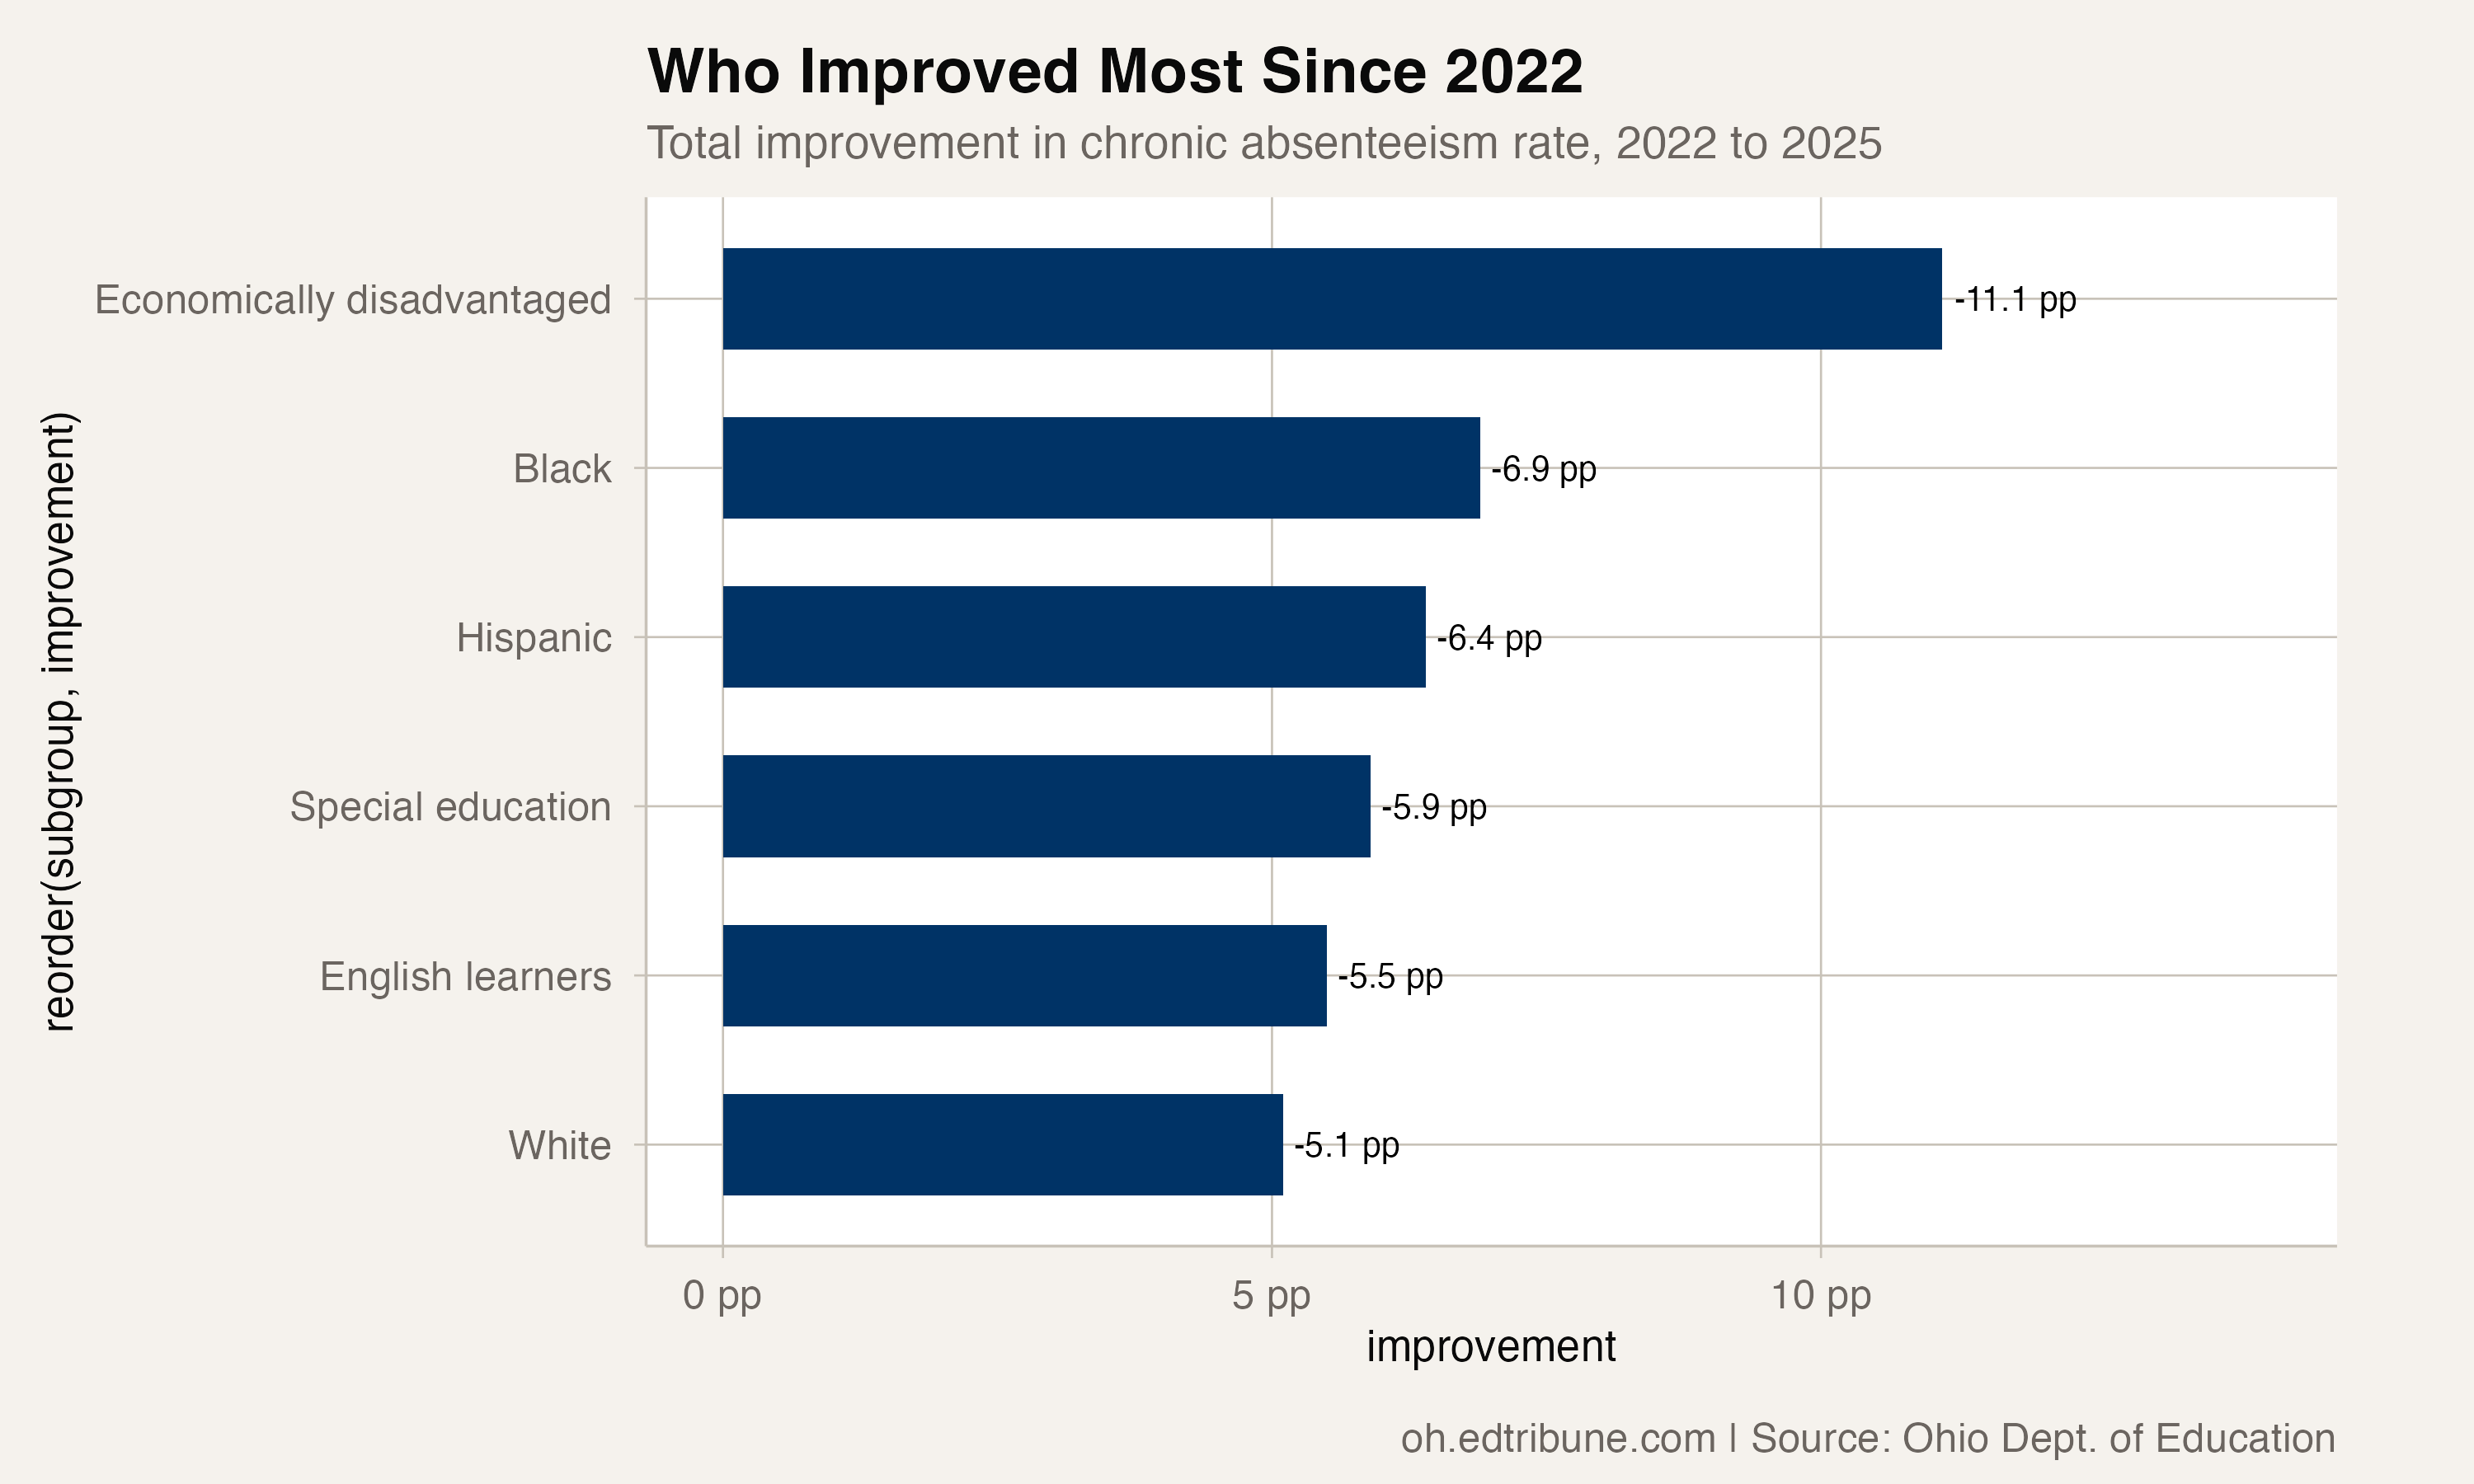
- Economically disadvantaged: 11.1-point improvement (44.4% → 33.3%)
- Black: 6.9-point improvement (49.8% → 42.9%)
- Hispanic: 6.4-point improvement (39.4% → 33.0%)
- Special education: 5.9-point improvement (39.9% → 34.0%)
- English learners: 5.5-point improvement (31.6% → 26.1%)
- White: 5.1-point improvement (24.2% → 19.1%)
The comparison establishes the size and ordering of the reported changes. It does not establish why one subgroup's rate fell faster than another's.
Competing explanations: Changes in subgroup composition, reporting, and attendance behavior could all affect the observed pattern. The Ohio absence package does not identify a mechanism.
At 14.2 points, the poverty gap remains substantial. The available data establish the gap and its narrowing; they do not establish a causal explanation.
Detailed code that reproduces the analysis and figures in this article is available exclusively to EdTribune subscribers.
Discussion
Sign in to join the discussion.
Loading comments...