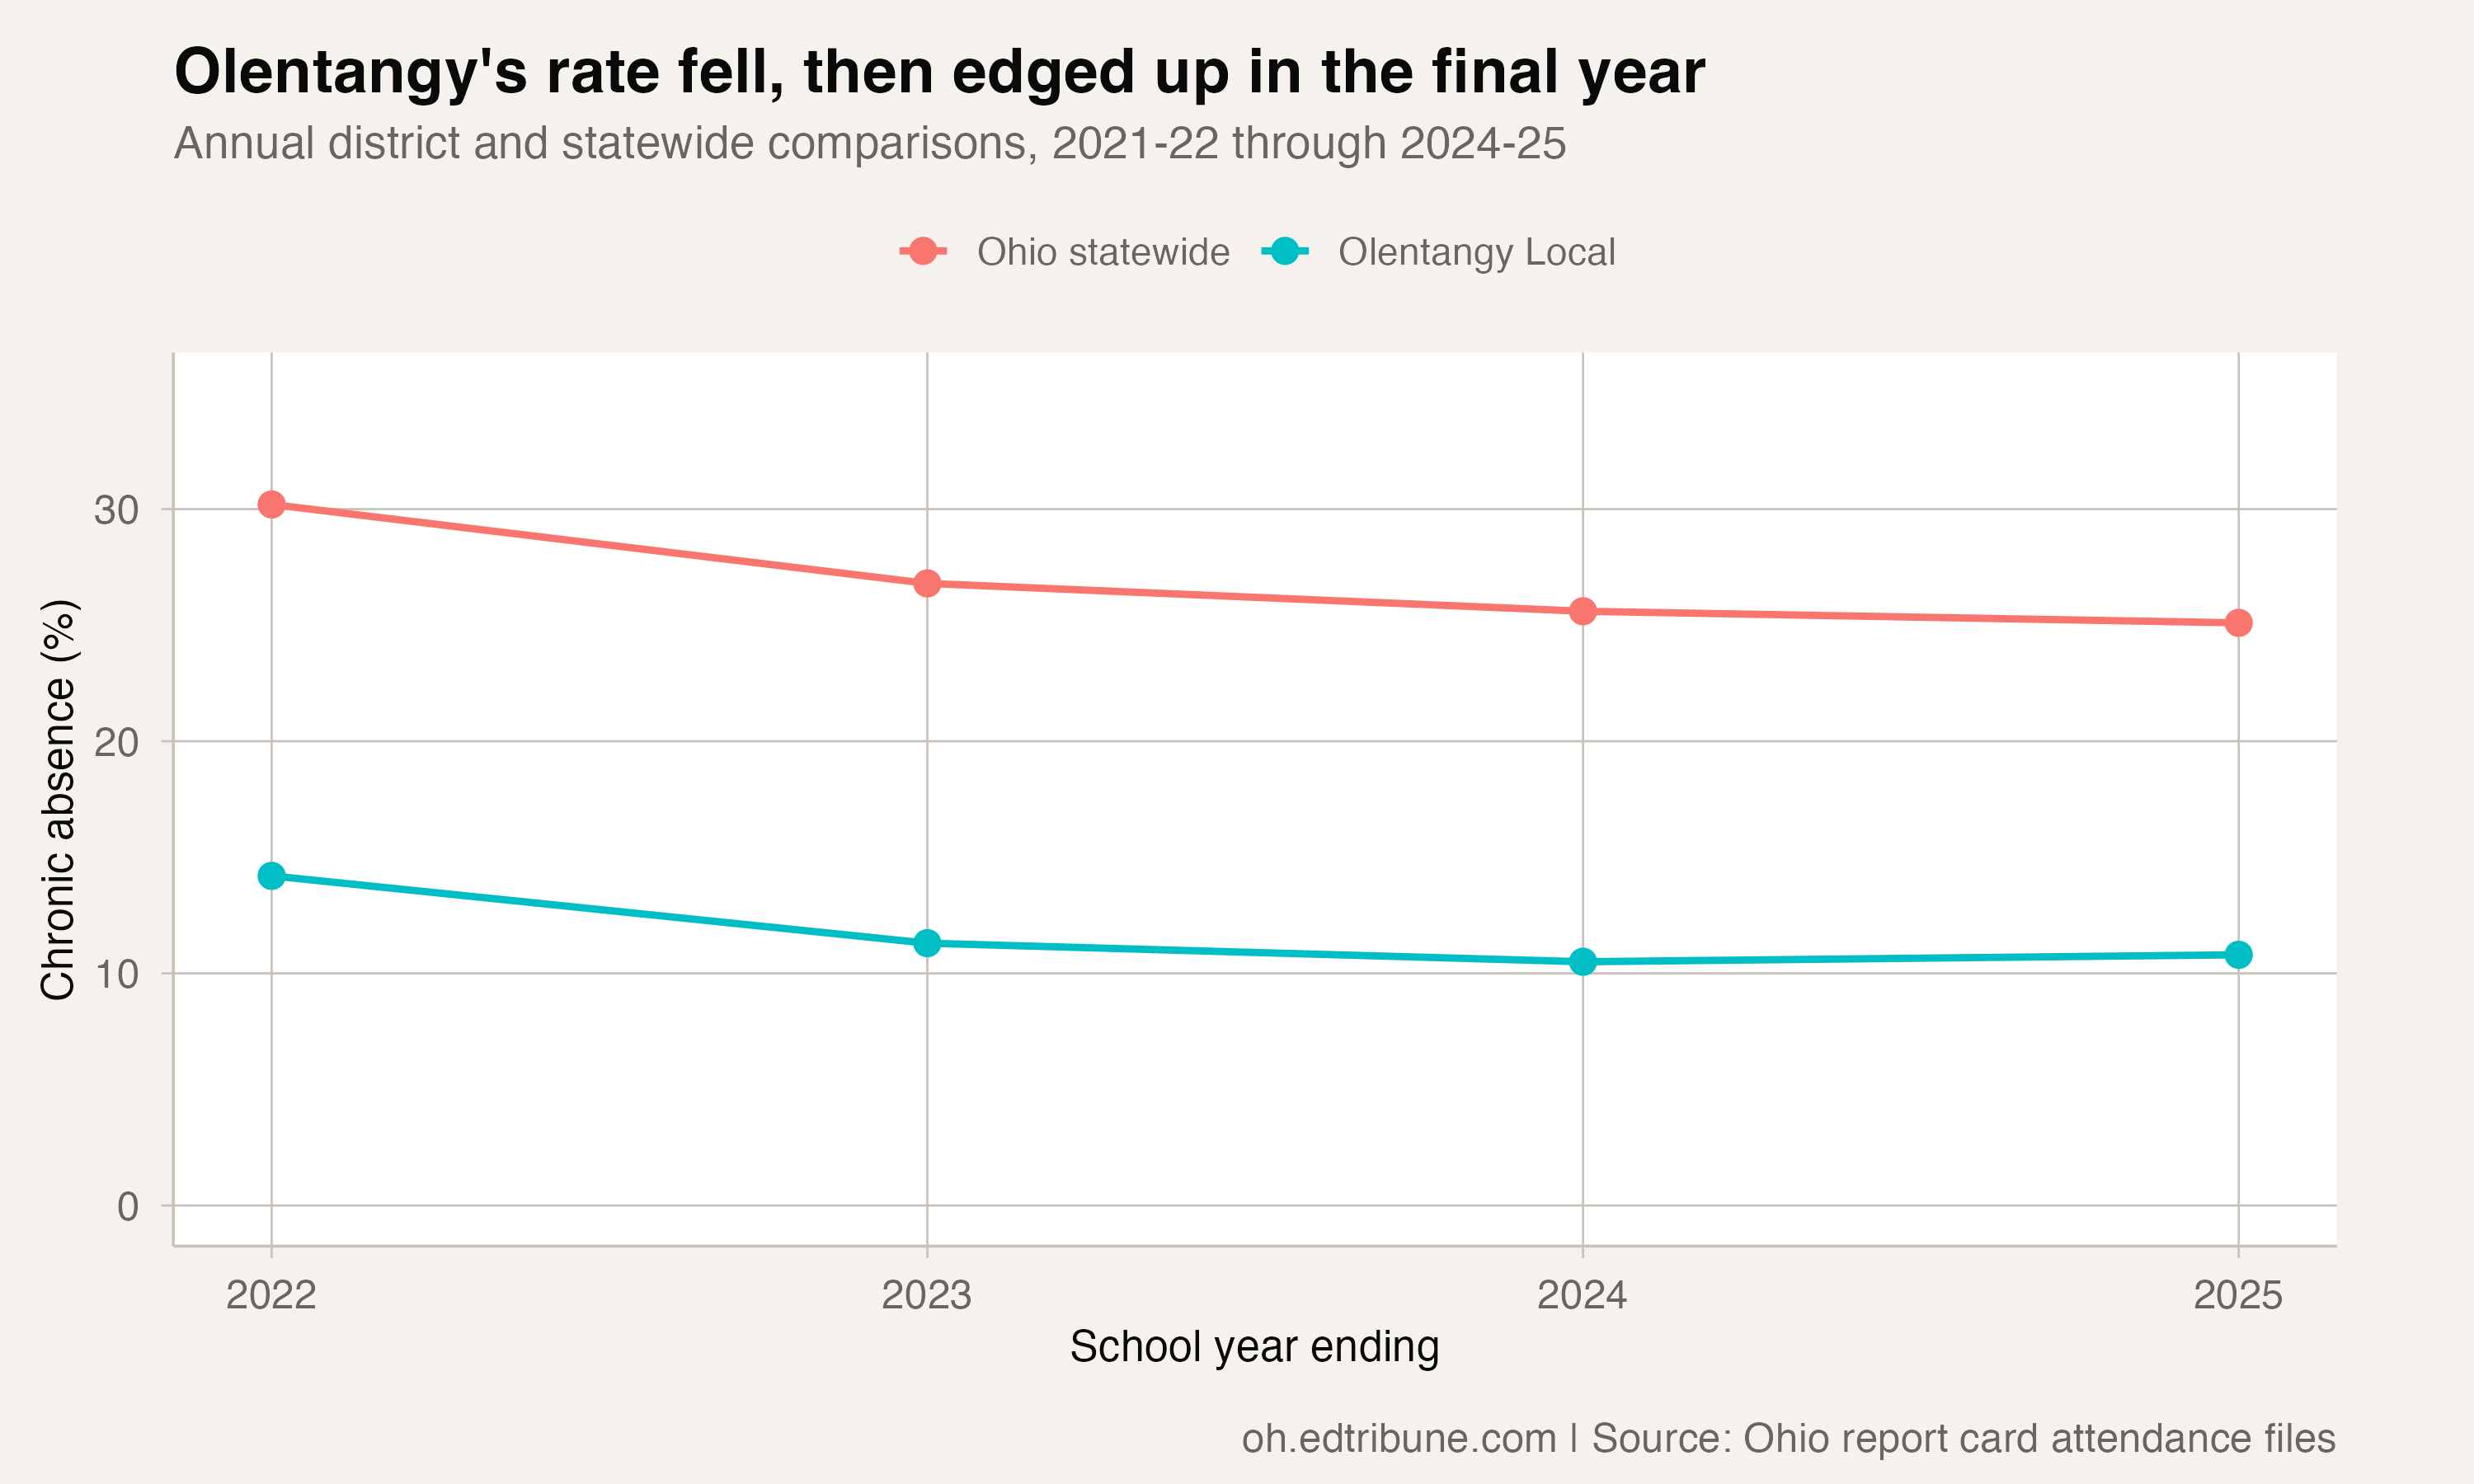
Olentangy Local↗ET reported 23,232 students and a chronic absence rate of 10.8% in 2024-25. Its rate was below Ohio's published statewide rate of 25.1% for that year.
The comparison shows that low reported absence rates occurred in some large districts. It does not establish what produced those rates, or whether another district could reproduce them through the same practices.
The figures come from Ohio's school report card attendance files, with 2024-25 the most recent published attendance year used here.
A defined large-district group
Among reports with at least five thousand students and a finite all-student absence rate, 35 districts were below the state rate. There were 57 districts in that comparison group.
The qualifying districts reported 291,090 students in total, or 17.6% of the state's published total enrollment. That share uses the statewide enrollment count, rather than adding together whatever student subgroups happen to be reported.
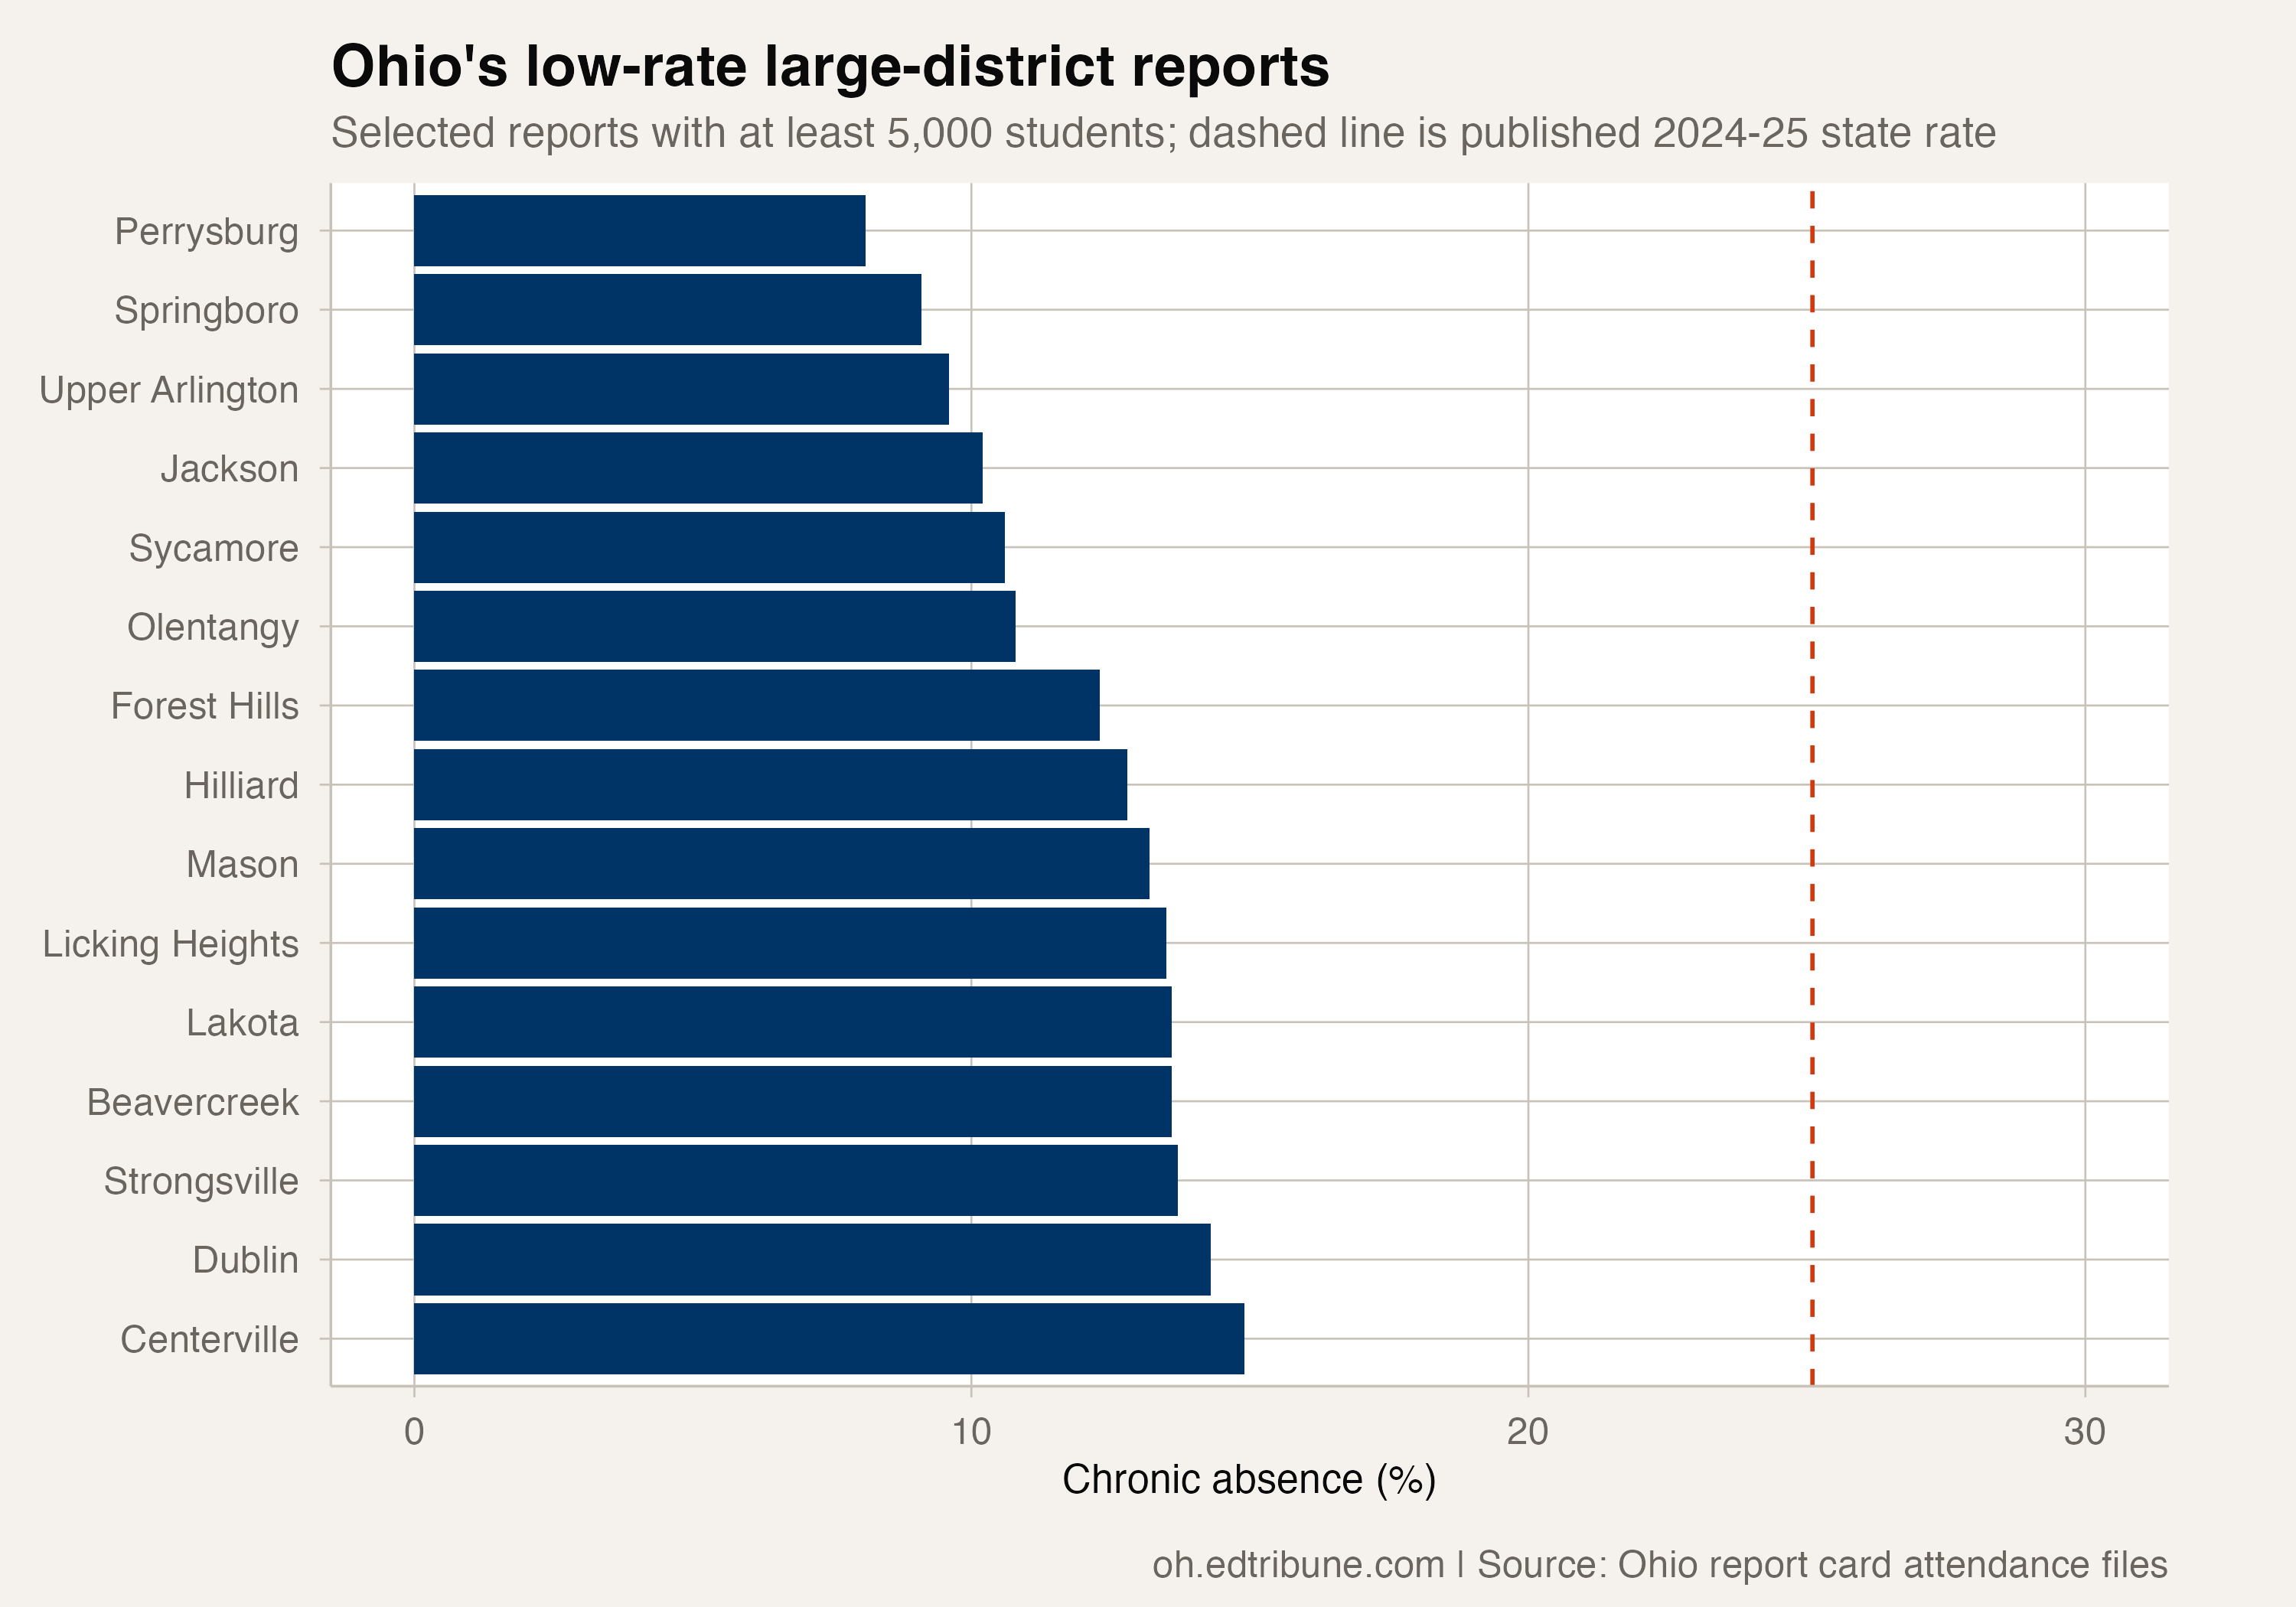
Perrysburg reported an absence rate of 8.1%, Springboro 9.1%, and Upper Arlington 9.6%. Those are selected examples from the complete qualifying group, rather than evidence of a particular attendance policy's effect.
Districts with substantial enrollment
Hilliard City↗ET reported 16,002 students and a chronic absence rate of 12.8%. Lakota Local↗ET reported 16,827 students and 13.6%, while Dublin City↗ET reported 16,259 and 14.3%.
Mason City↗ET reported 9,867 students and a rate of 13.2%. These examples show that below-state rates were not confined to districts with very small enrollment.
The rates also differ within the qualifying group. Westerville reported 17.8%, and Pickerington 17.6%. Being below the statewide rate does not mean an absence problem has disappeared.
Olentangy's rate fell, then edged upward
Olentangy's rate was 14.2% in 2021-22, fell to 10.5% in 2023-24, and edged up to 10.8% in 2024-25. Across the endpoints, its rate fell by 3.4 percentage points; in the final annual comparison, it rose by 0.3 points.
Its reported enrollment rose from 21,803 to 23,232 students over the same window, a gain of 1,429. Enrollment growth and a lower endpoint absence rate occurred together. The files do not show that growth caused the attendance result, or that a district's size determines its rate.
What the differences can tell us
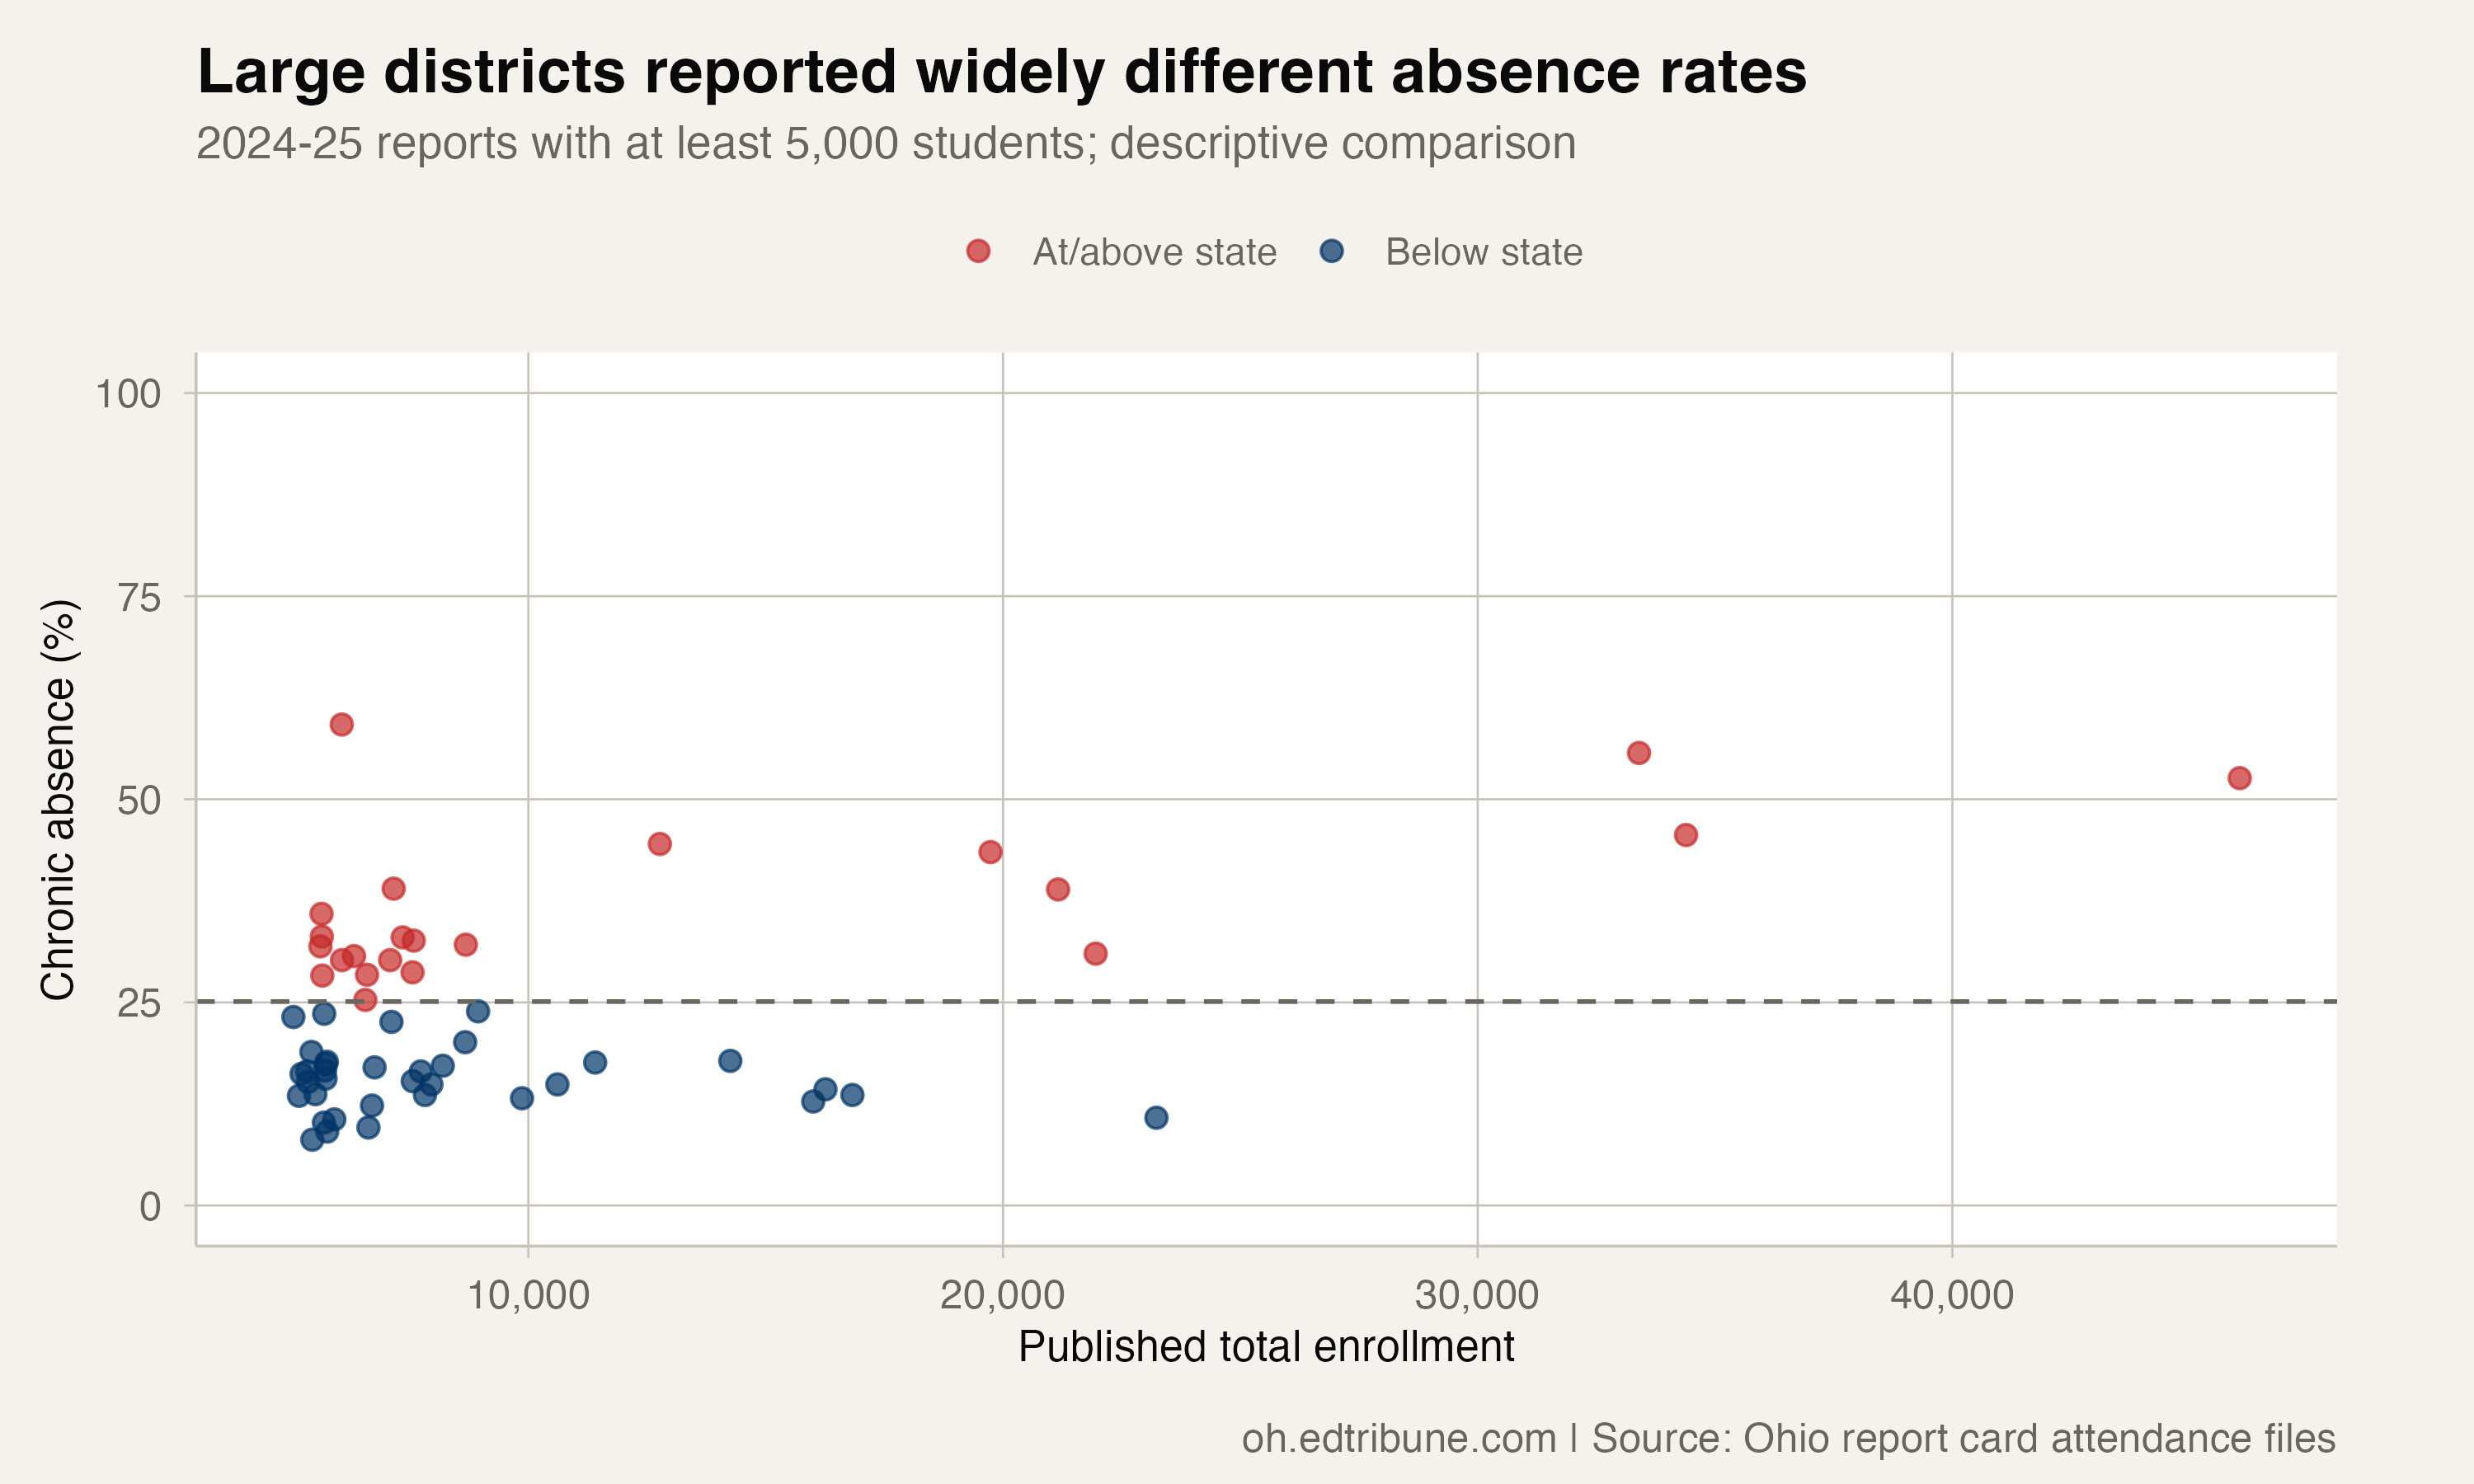
The scatter plot shows substantial variation among large districts. That is a descriptive finding. It is not a test of household income, housing stability, transportation or family structure, none of which are measured in this attendance comparison.
Olentangy and the other qualifying districts provide documented examples of below-state rates at substantial enrollment levels. Reporting from those communities would be needed to identify their attendance practices and assess how much those practices explain the differences.
The statewide benchmark is useful for locating examples. A district's own annual trajectory adds another question: whether its rate is still improving, as Olentangy's final-year increase illustrates.
Detailed code that reproduces the analysis and figures in this article is available exclusively to EdTribune subscribers.
Discussion
Sign in to join the discussion.
Loading comments...