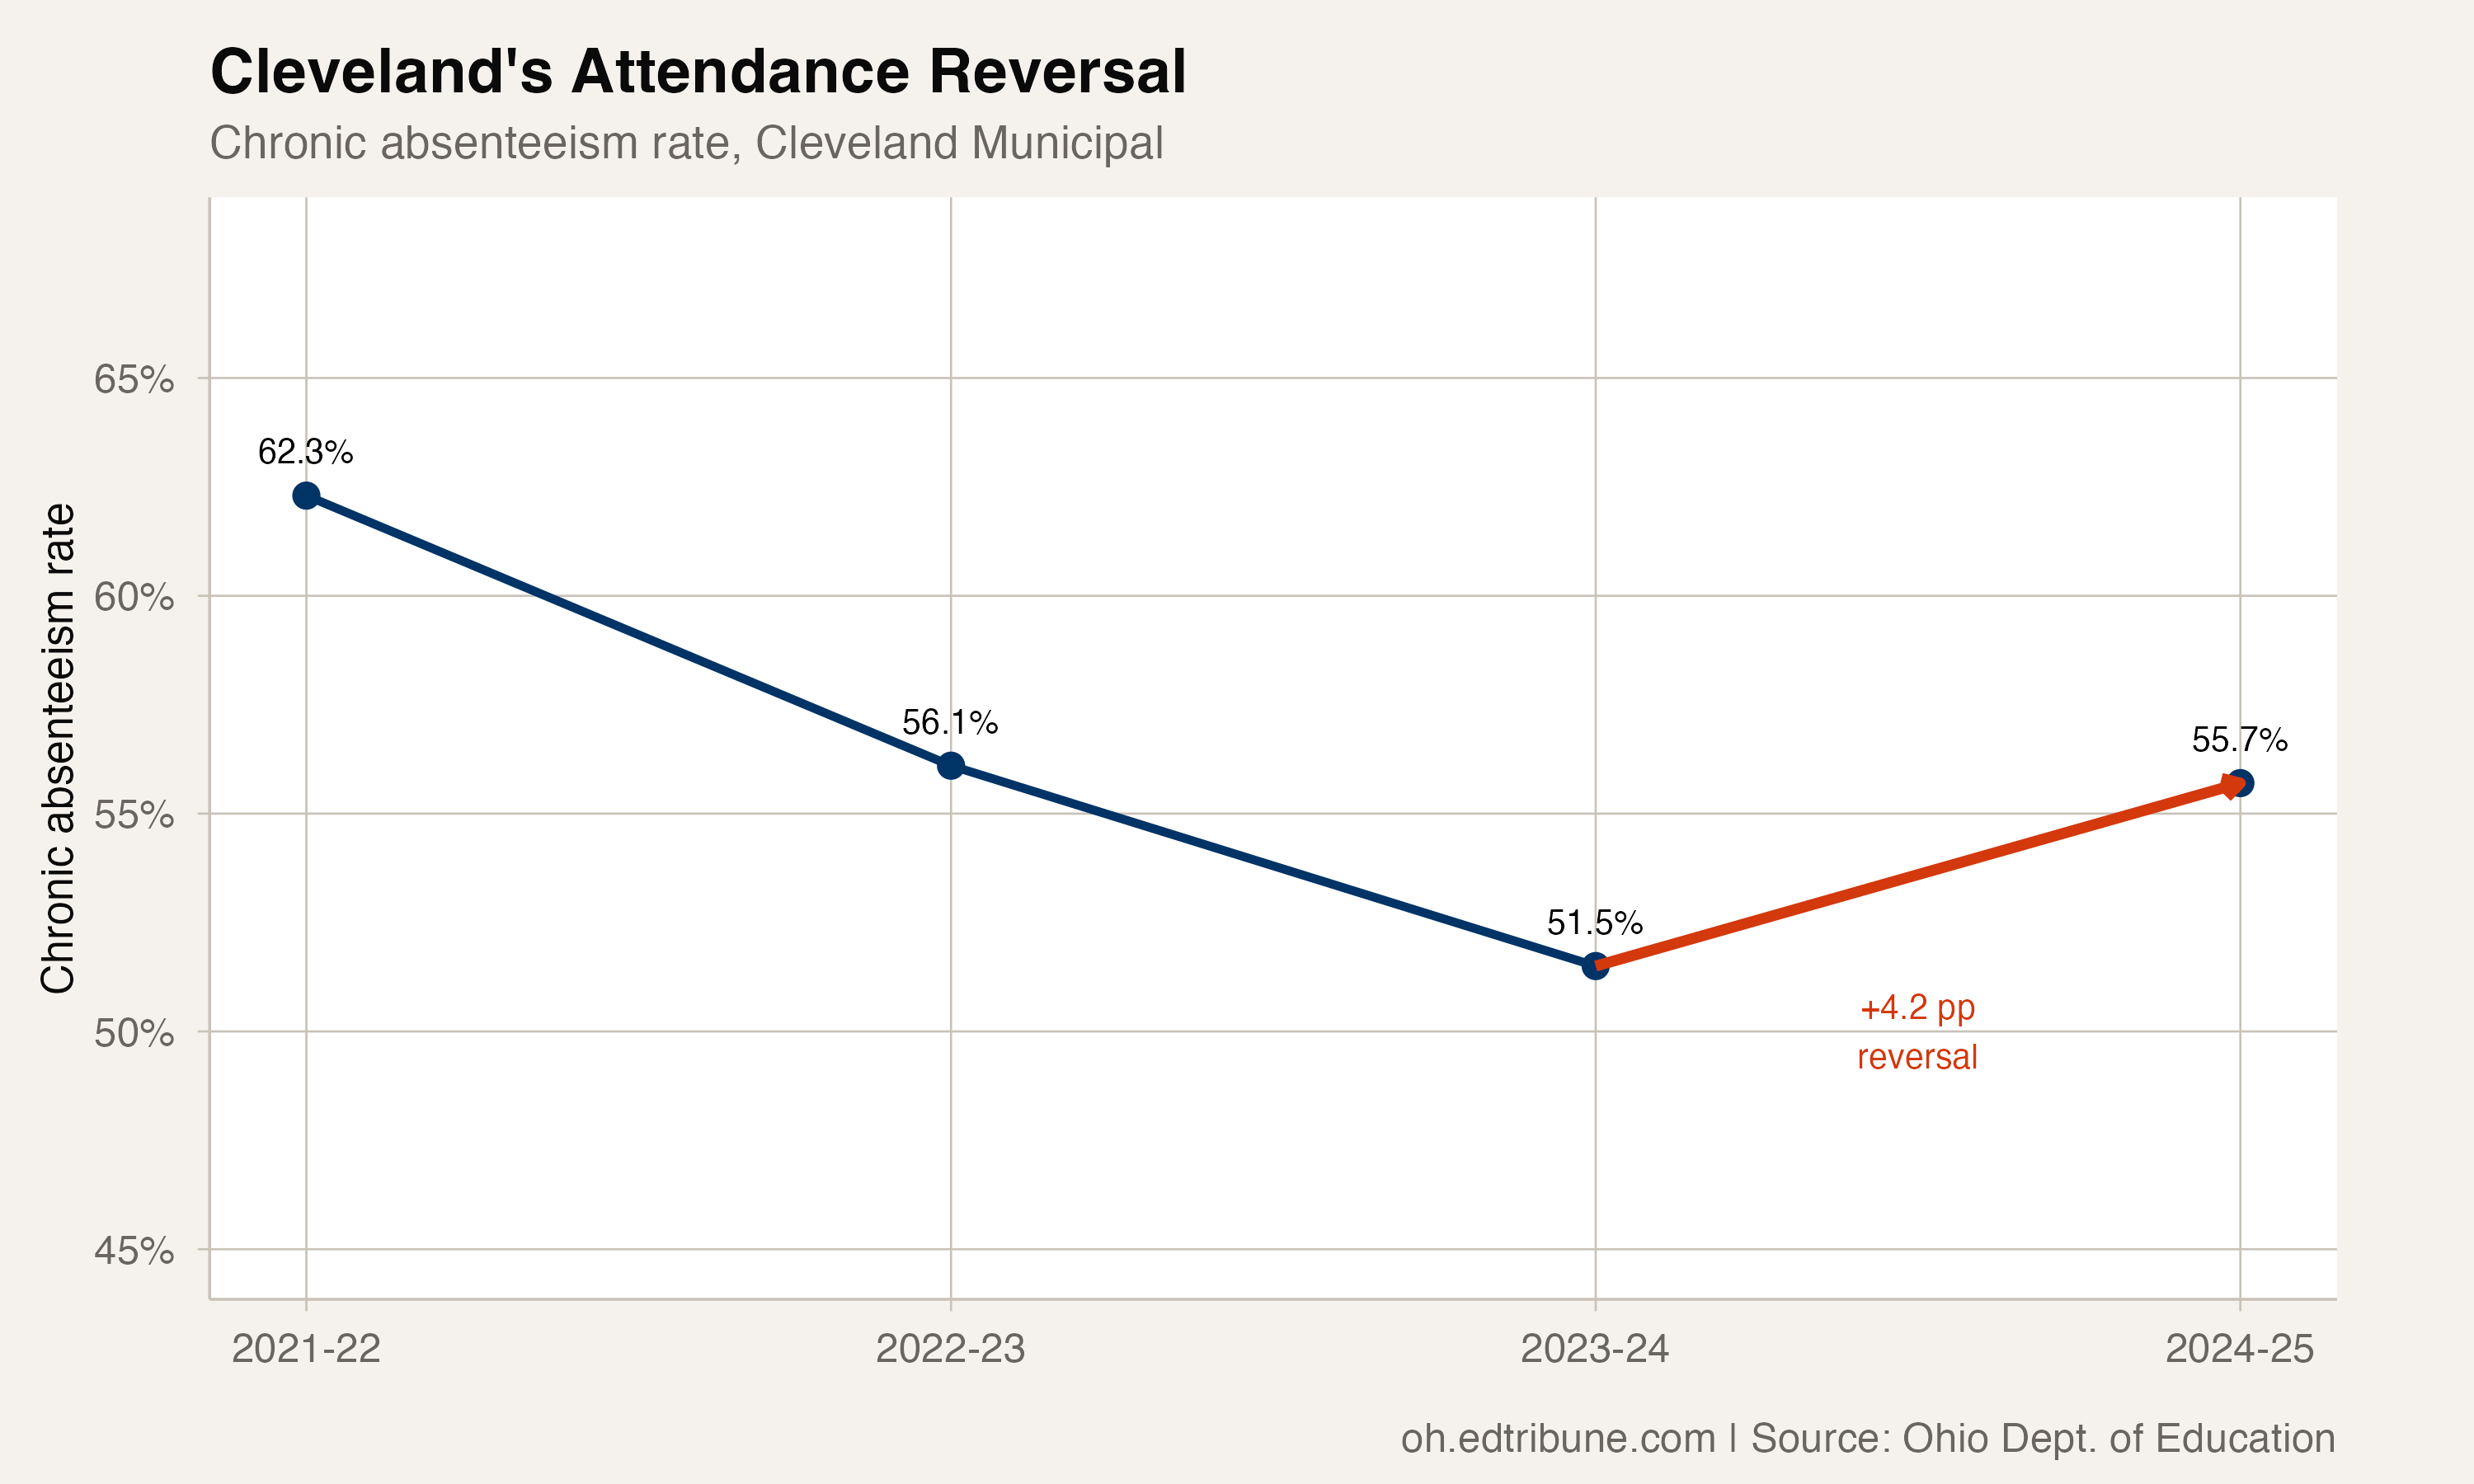
Cleveland Municipal↗ET cut its chronic absenteeism rate for two consecutive years, from 62.3% in 2021-22 to 56.1% and then 51.5%.
Then the rate jumped to 55.7% in 2024-25. The 4.2-point increase erased 38.9% of the 10.8-point improvement recorded over the prior two years.
Every Subgroup, Same Direction
All seven major subgroups examined here worsened between 2023-24 and 2024-25:
- Black students: 53.8% to 58.6% (+4.8 points)
- All students: 51.5% to 55.7% (+4.2 points)
- English learners: 41.6% to 45.8% (+4.2 points)
- Hispanic students: 48.7% to 52.9% (+4.2 points)
- Special education students: 54.4% to 58.5% (+4.1 points)
- Students eligible for free or reduced-price lunch: 51.6% to 55.6% (+4.0 points)
- White students: 46.1% to 48.2% (+2.1 points)
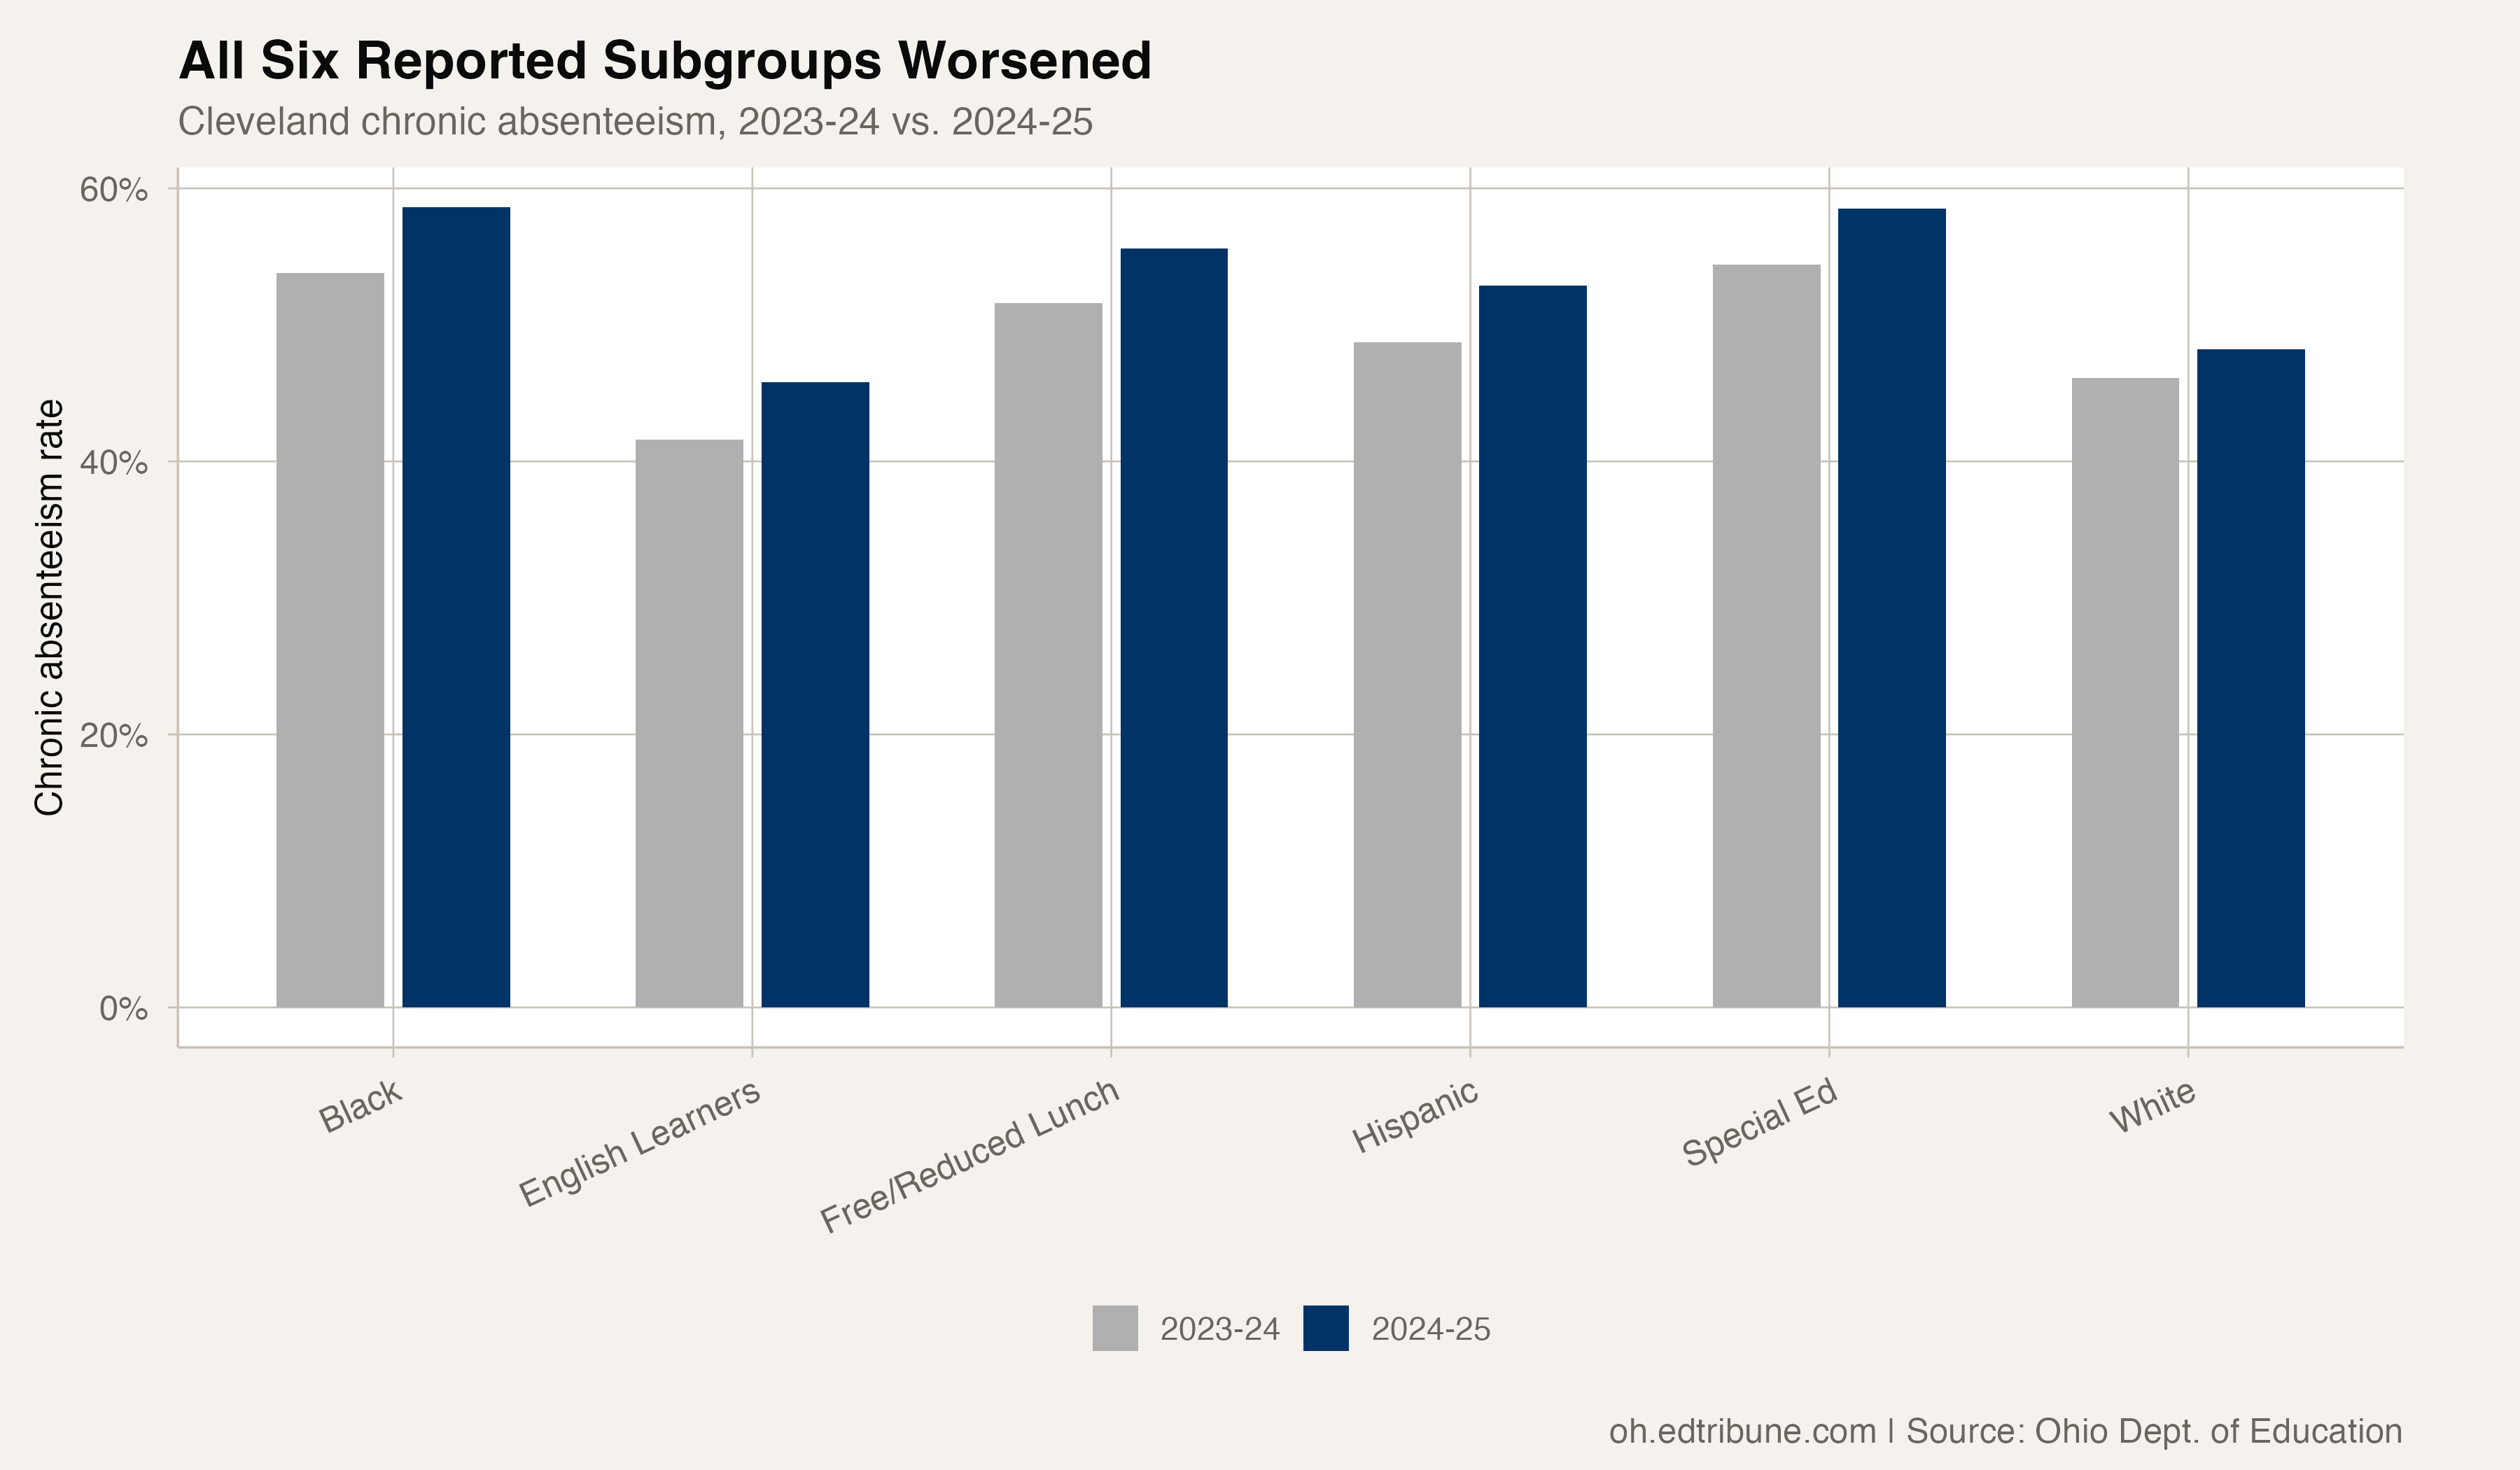
The subgroup data shows that the reversal was broad rather than confined to one of these reported groups. It does not identify a districtwide cause.
The Akron Contrast
Akron City↗ET moved in the other direction. Its chronic absenteeism rate declined each year, from 49.9% in 2021-22 to 47.4%, 44.7%, and 43.5% in 2024-25.
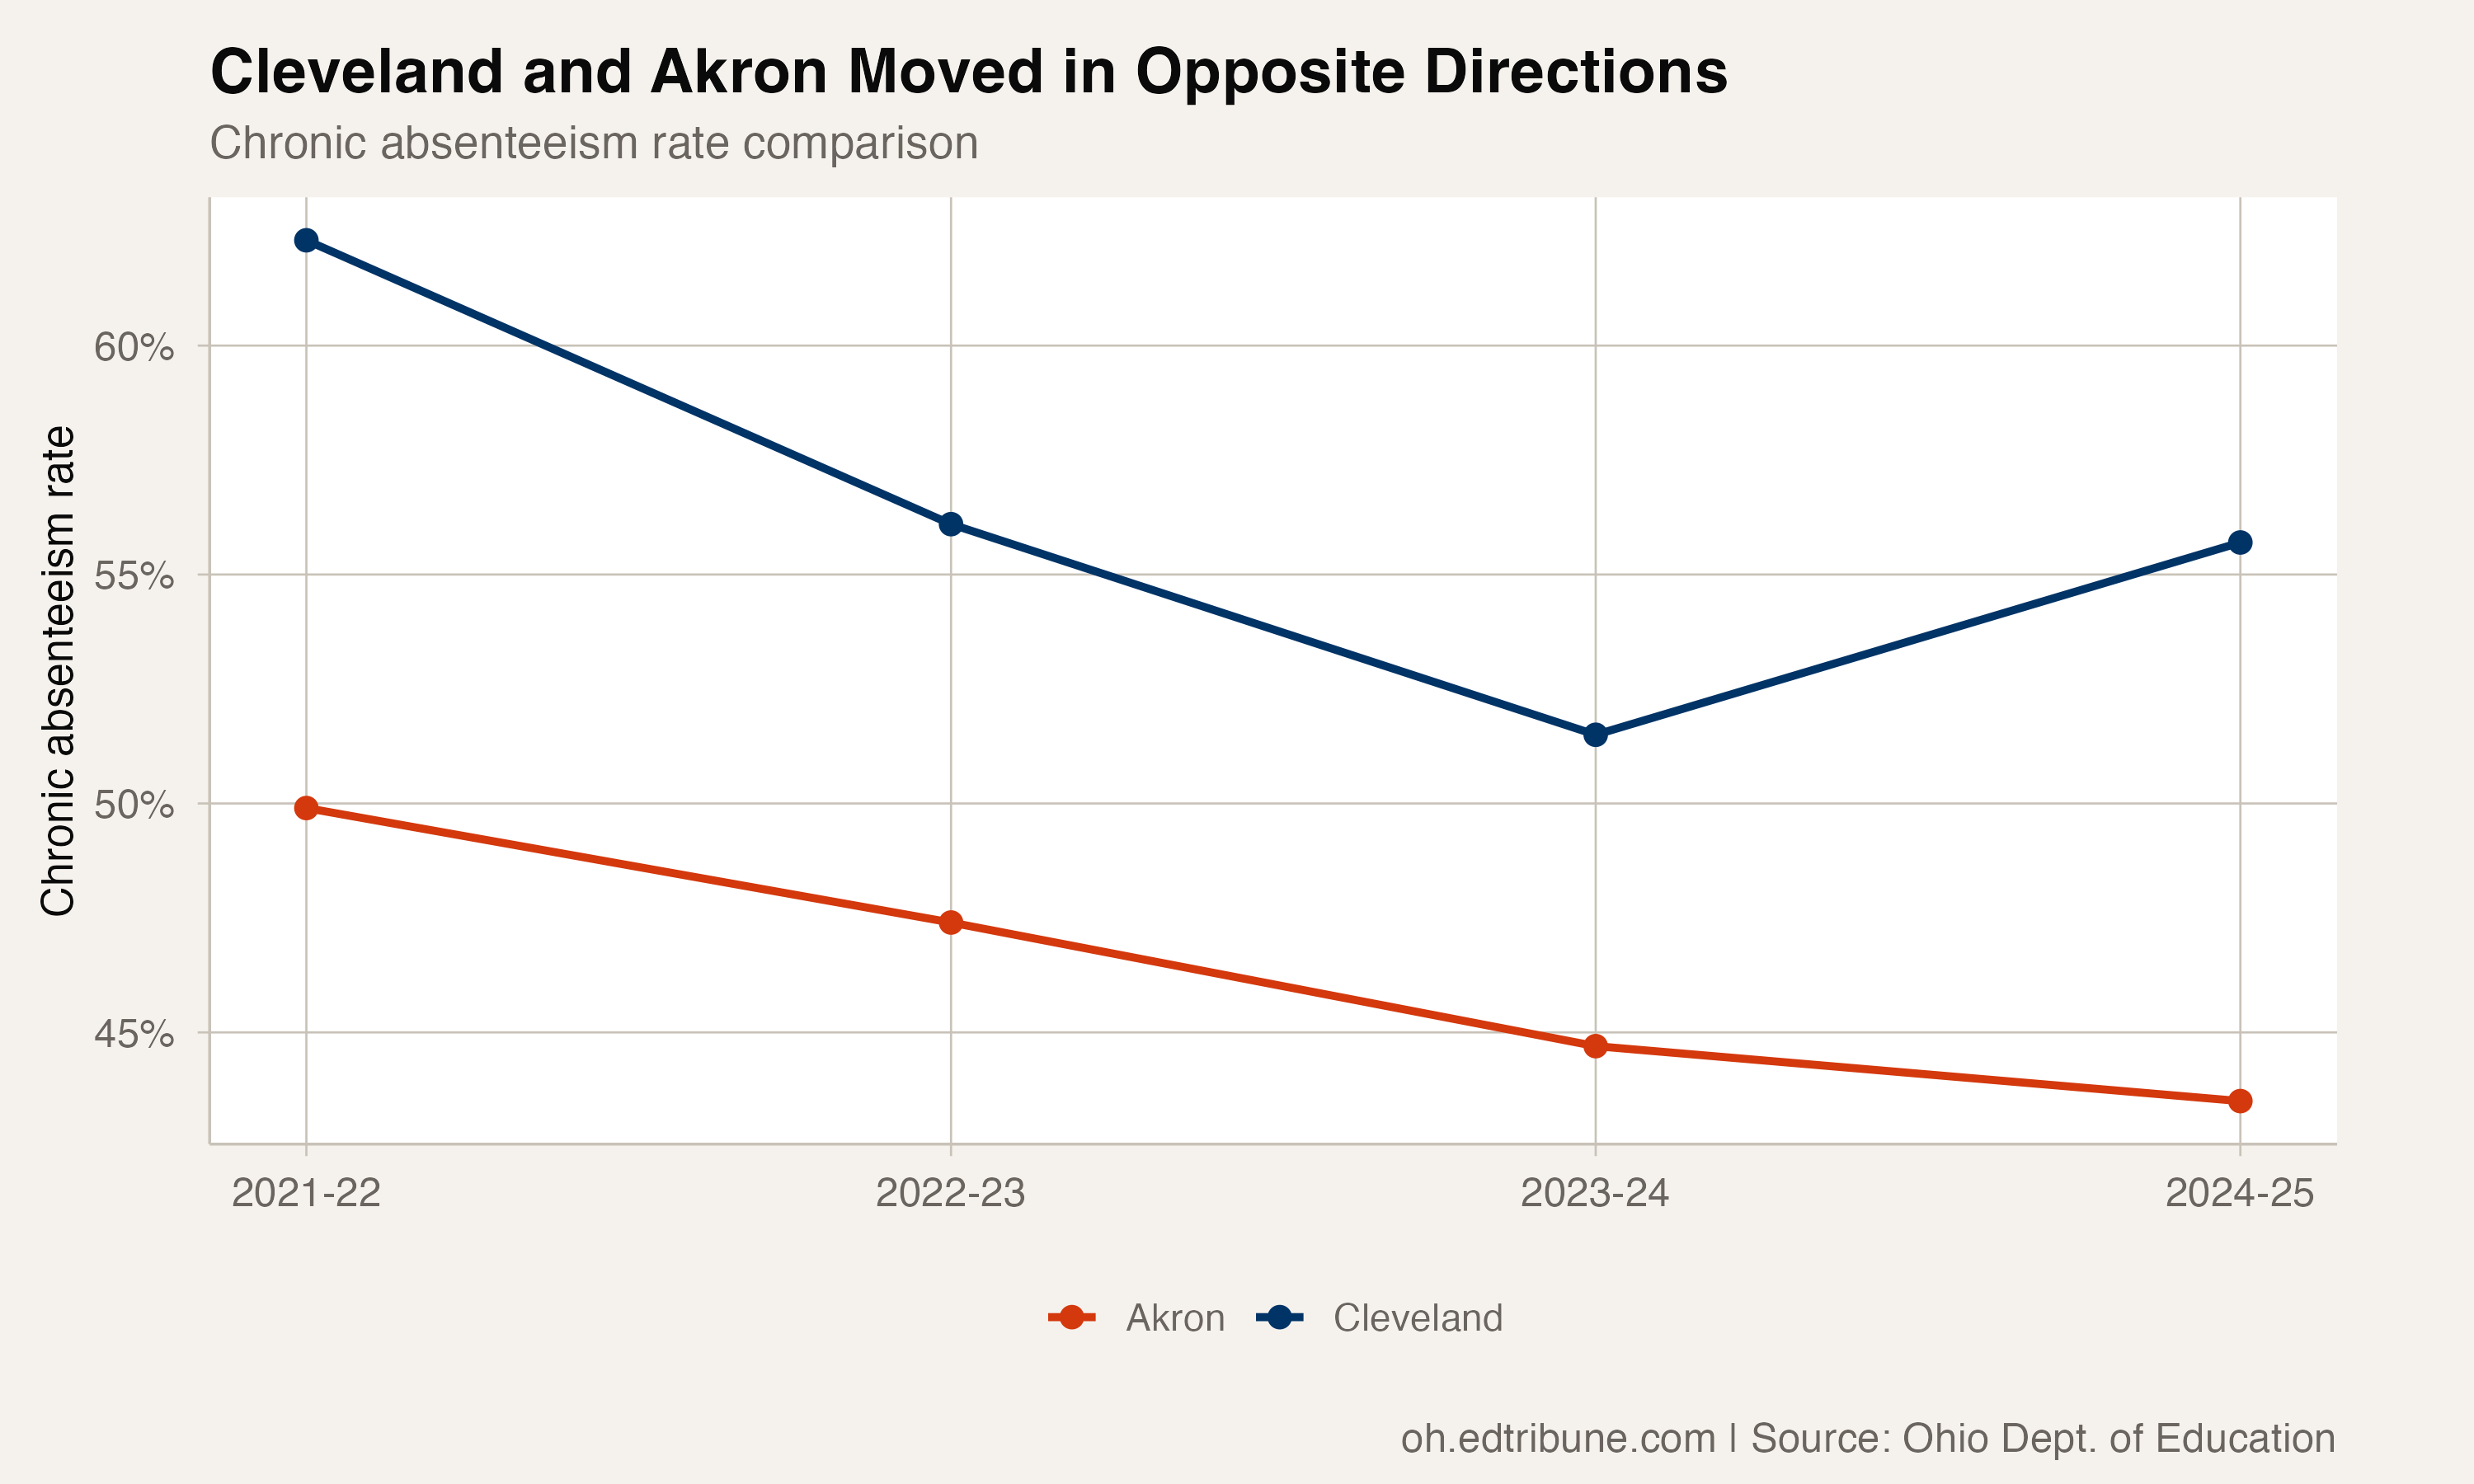
The gap between the two districts was 12.2 percentage points in 2024-25, up from 12.4 points in 2021-22 after narrowing to 6.8 points in 2023-24. That comparison describes the divergence; it does not establish which policies or outside conditions produced it.
What Changed
Cleveland's 2024-25 reversal raises a question the absence data alone cannot answer: what changed after two years of improvement? The published rates identify the timing and breadth of the reversal, but explaining it requires evidence beyond this dataset.
Analysis uses chronic absenteeism data published by the Ohio Department of Education and Workforce.
Detailed code that reproduces the analysis and figures in this article is available exclusively to EdTribune subscribers.
Discussion
Sign in to join the discussion.
Loading comments...