Springboro Community City↗ET and Lorain City↗ET are both Ohio school districts with roughly 6,000 students. The comparison ends there.
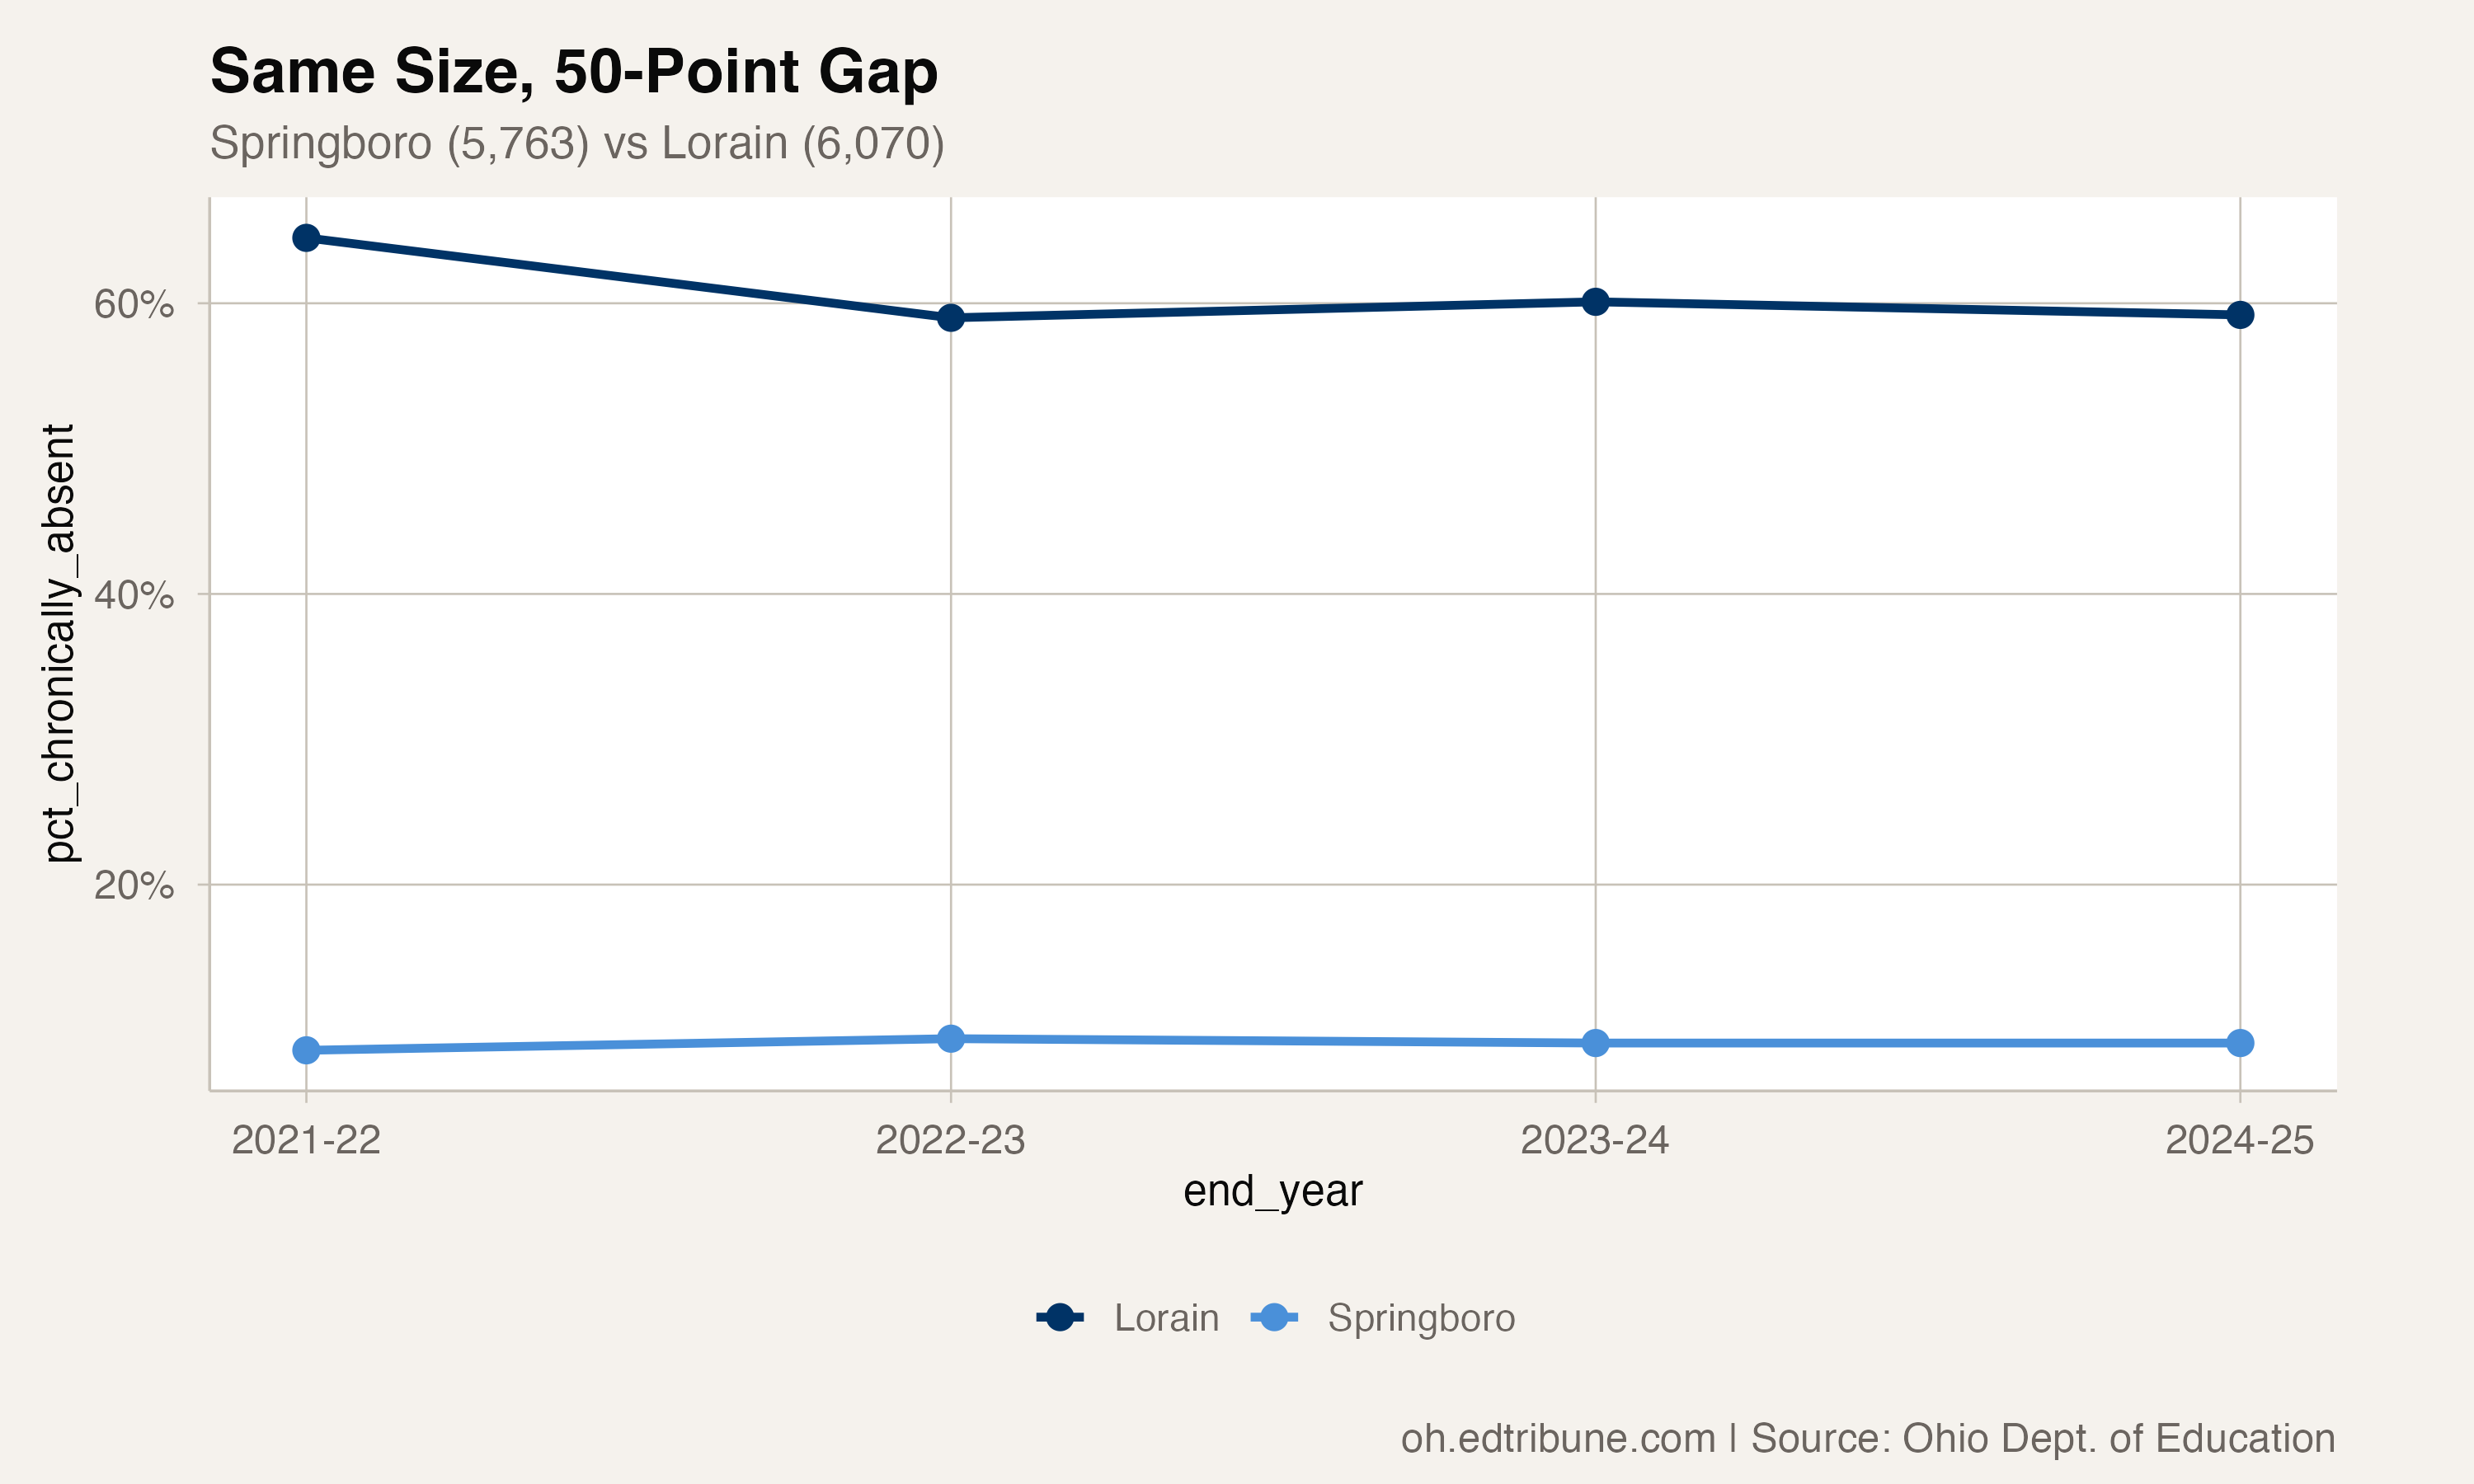
Springboro's chronic absenteeism rate in 2024-25 was 9.1%. Lorain's was 59.2%. The 50.1-point gap between two similarly-sized districts in the same state distills Ohio's attendance crisis into a single comparison: in Springboro, about 524 students are chronically absent. In Lorain, 3,593.
Two Worlds, Stable Over Time
The gap is not a one-year anomaly. Springboro has been between 8.6% and 9.4% for all four years of available data. Lorain has been between 59.0% and 64.5%. Neither district is trending toward the other. The 50-point gap in 2025 is nearly identical to the 55.9-point gap in 2022 — Lorain improved slightly, but so did Springboro's already-low rate.
The attendance records show a large and persistent difference, but they do not identify the household-level causes of that difference.
The Large-District Spectrum
Zooming out to all districts with 3,000 or more students reinforces the pattern. The lowest chronic rates in this group include Solon (7.6%), Perrysburg (8.1%), Hudson (9.3%) and Upper Arlington (9.6%). The highest include Lorain (59.2%), Youngstown (57.9%), Cleveland (55.7%) and Columbus (52.6%).
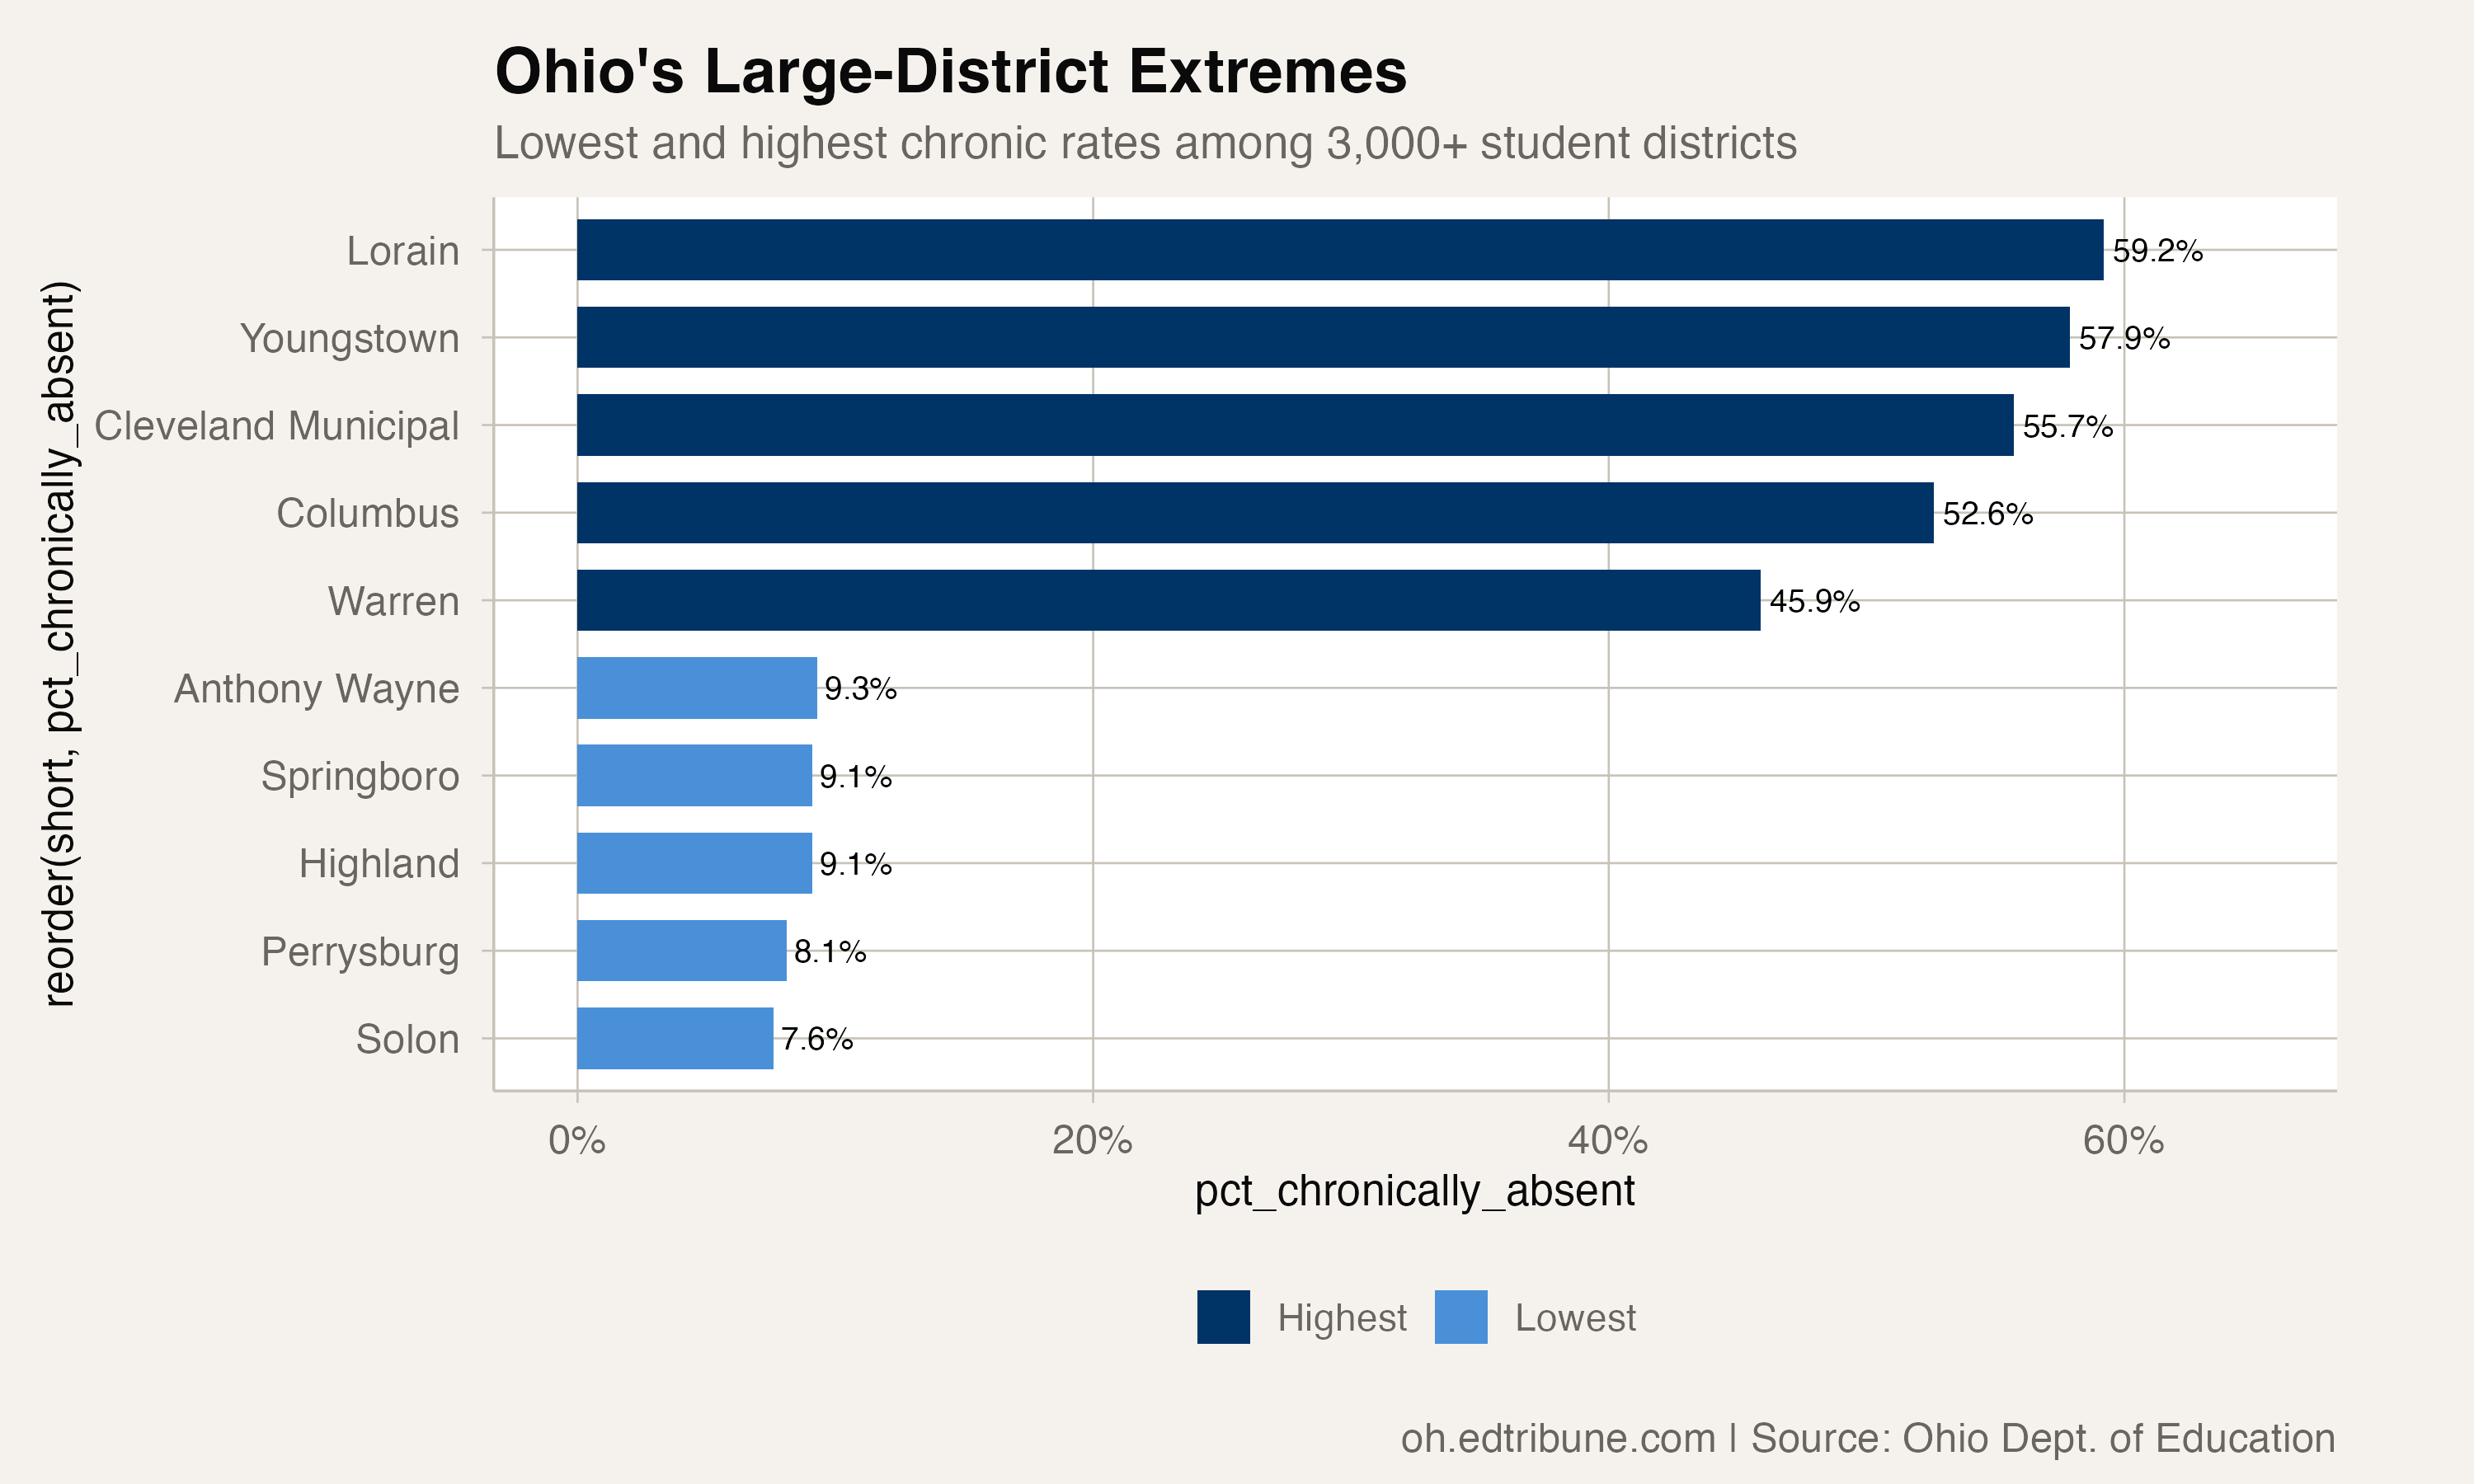
The gap between the lowest (Solon at 7.6%) and highest (Lorain at 59.2%) large-district rates is 51.6 points. The records describe the range of outcomes; they do not identify the mechanisms behind it.
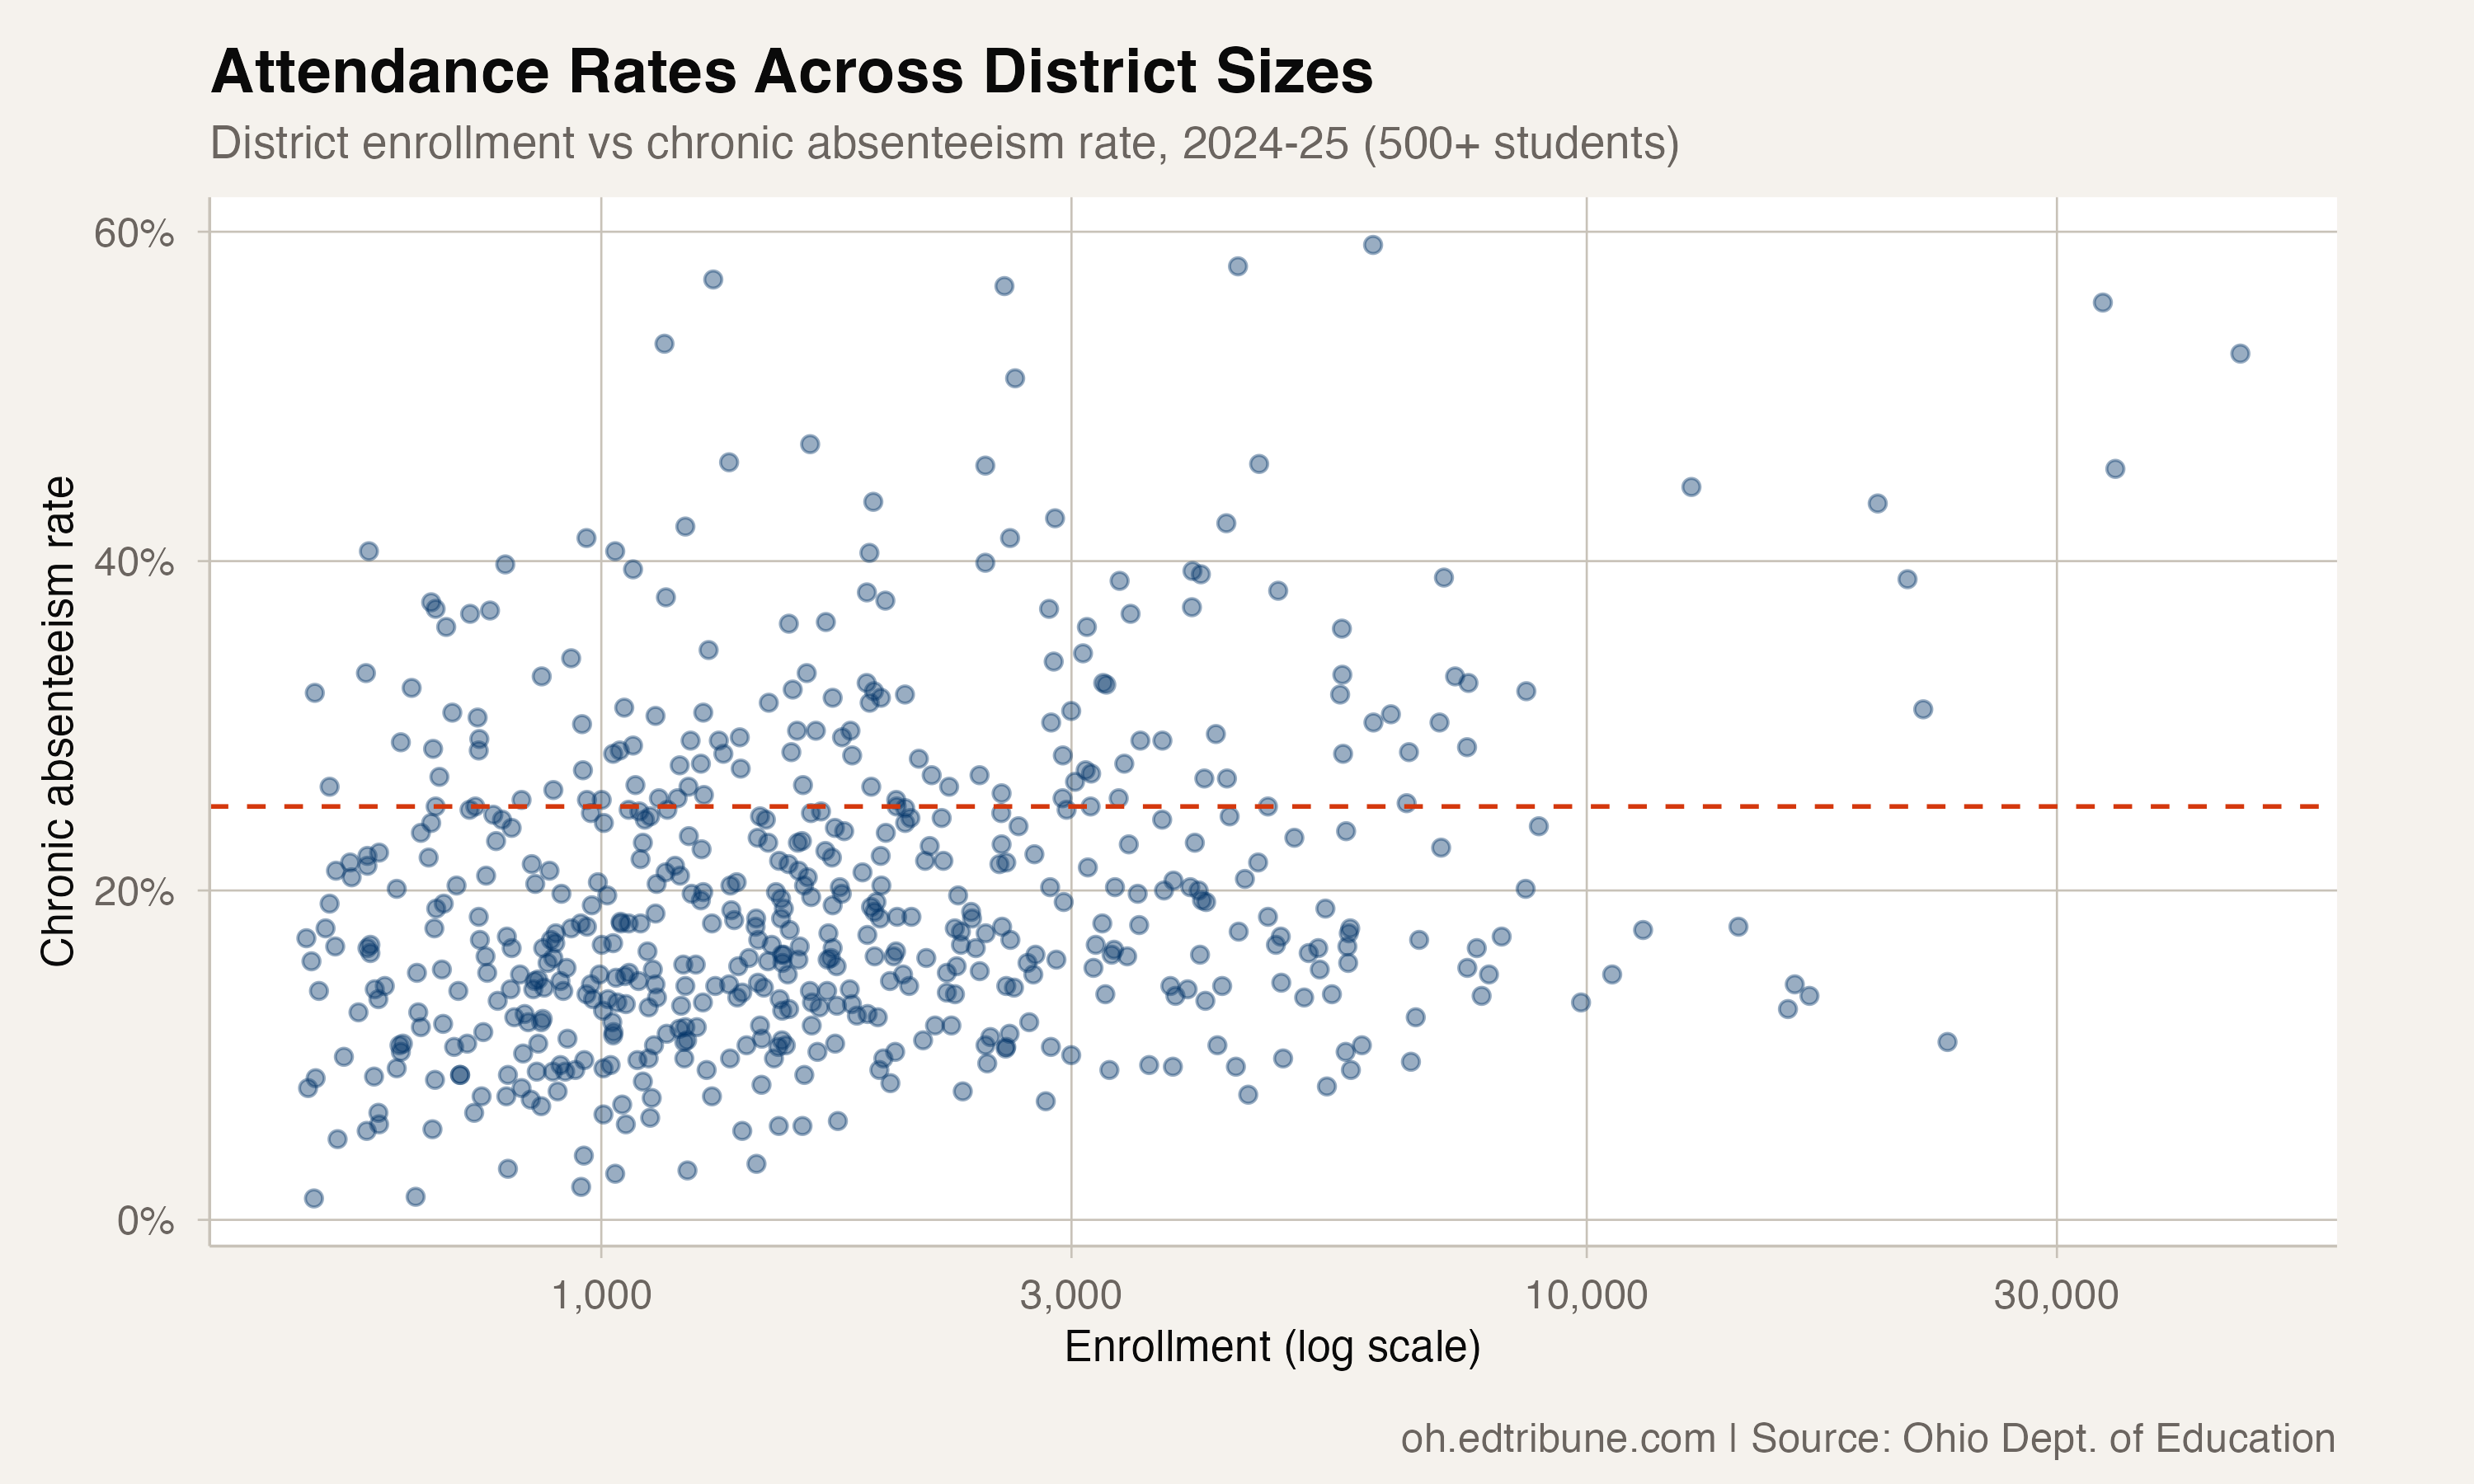
The scatter plot shows no simple size-based pattern in the published rates. Some of Ohio's largest districts — Dublin (14.3%, 16,259 students), Olentangy (10.8%, 23,232 students) — have rates comparable to Springboro. The published rates vary across the enrollment range rather than moving in lockstep with district size.
What the Comparison Proves
The Springboro-Lorain comparison is not meant to shame one district or celebrate another. It describes two sharply different attendance outcomes in the same state. The package does not contain household income, housing, transportation, health, or student-transfer measures, so it cannot say which mechanisms produced the gap or whether students moved between systems.
Detailed code that reproduces the analysis and figures in this article is available exclusively to EdTribune subscribers.
Discussion
Sign in to join the discussion.
Loading comments...