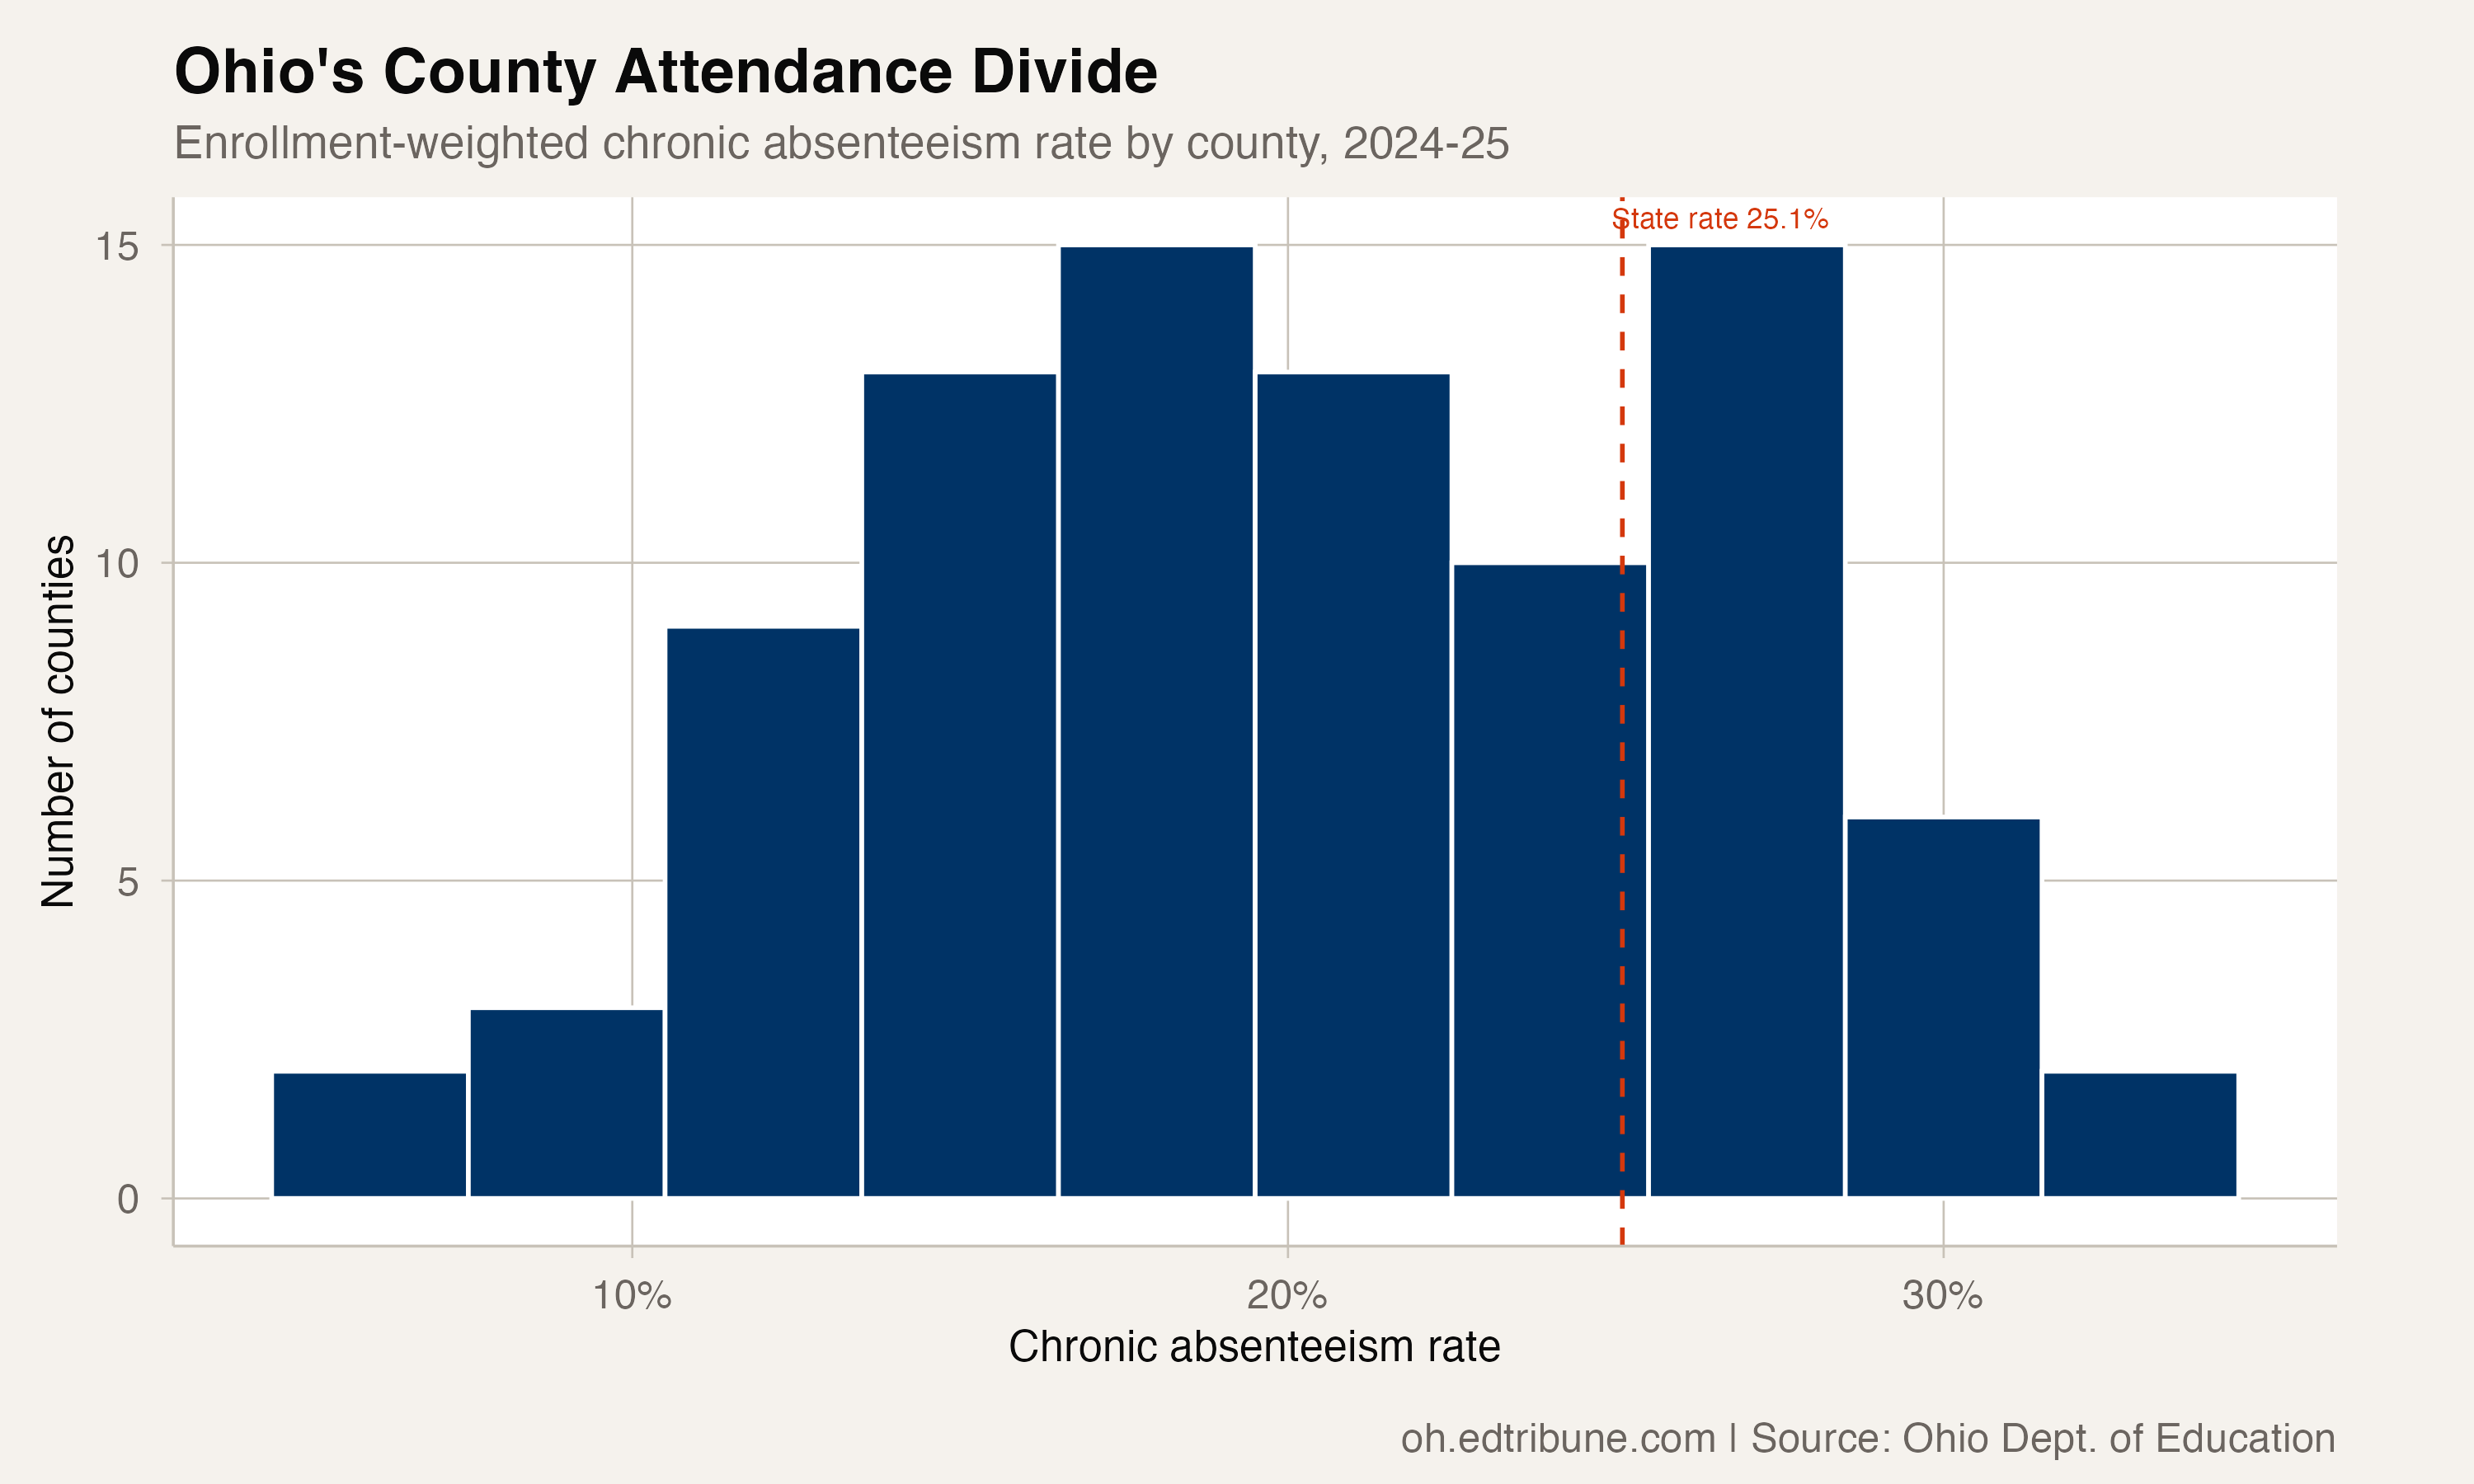
In 2024-25, Ohio's enrollment-weighted chronic absenteeism rate ranged from 6.2% in Putnam County to 32.1% in Cuyahoga County — a 5.2-to-1 difference. Putnam's rate covers 5,567 students across nine districts; Cuyahoga's covers 126,151 students across 31 districts.
The comparison uses each district's published Enrollment denominator. It does not add up surviving subgroup rows, which can omit suppressed values.
The lowest-rate counties
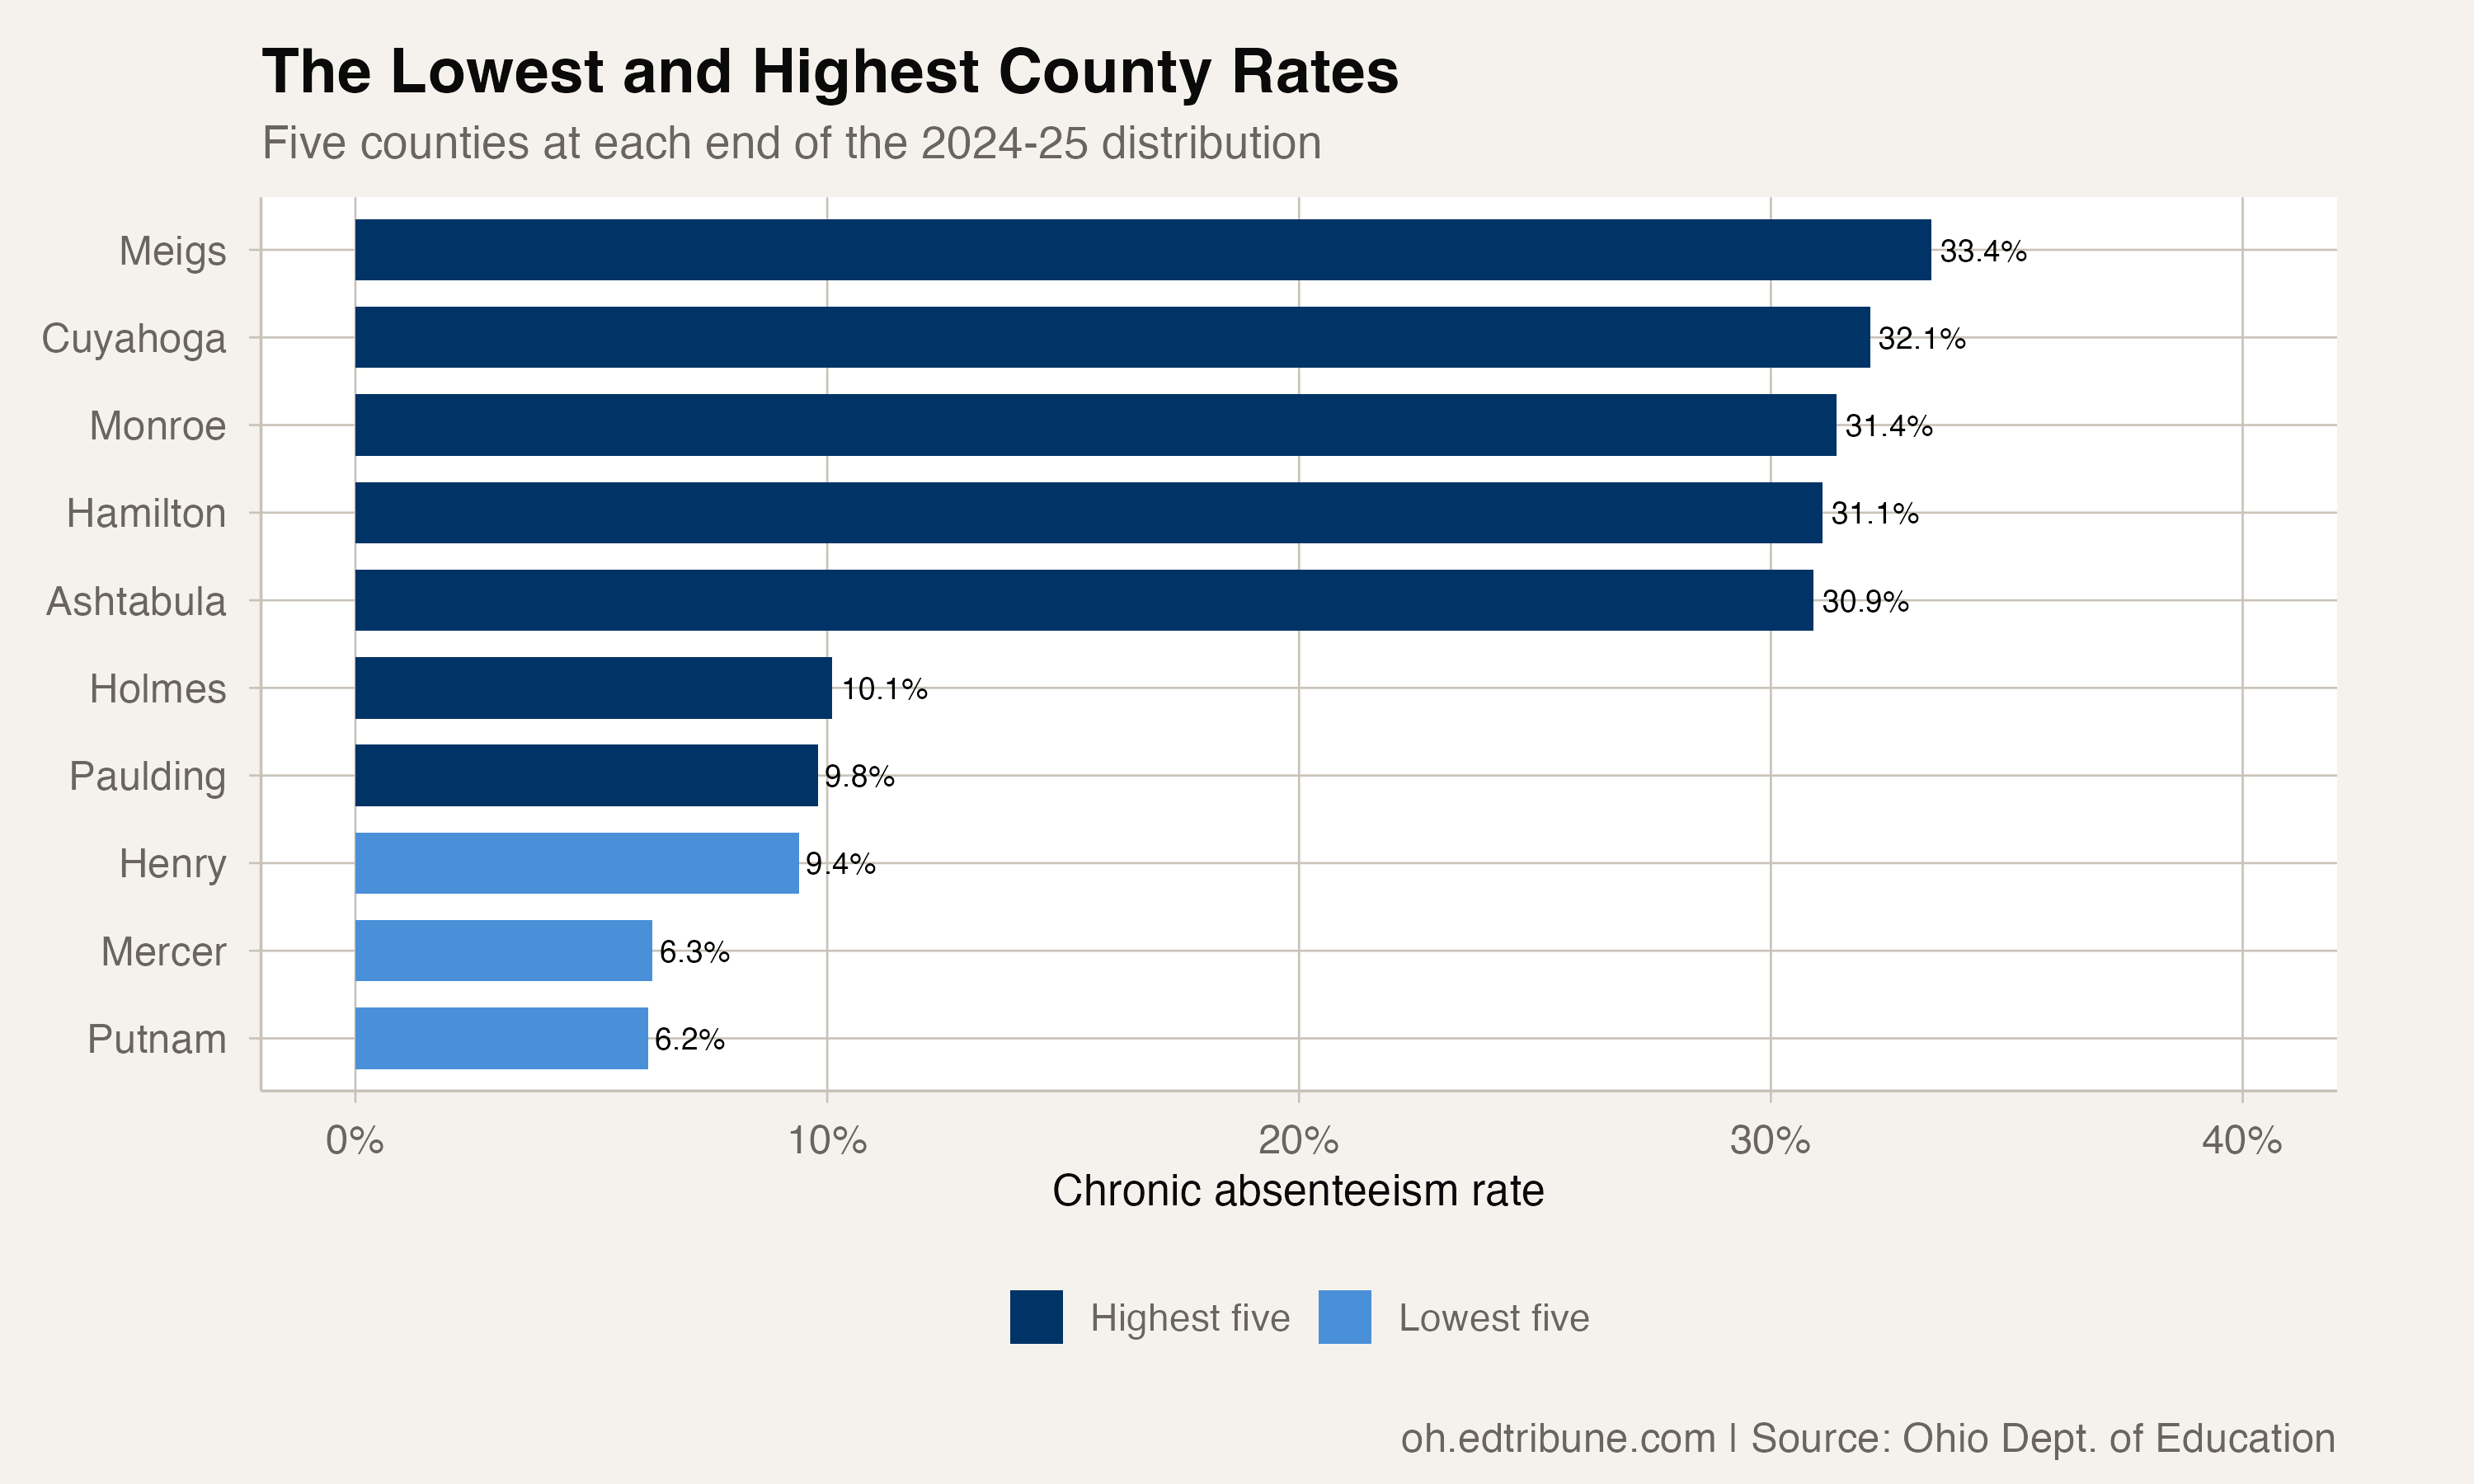
Putnam had Ohio's lowest enrollment-weighted county rate at 6.2%. Mercer followed at 6.3%, then Henry at 9.4%, Paulding at 9.8% and Holmes at 10.1%.
Those rates describe the district mix within each county; they do not establish why one county's rate differs from another's. The package data supplies attendance rates and published denominators, not a causal explanation.
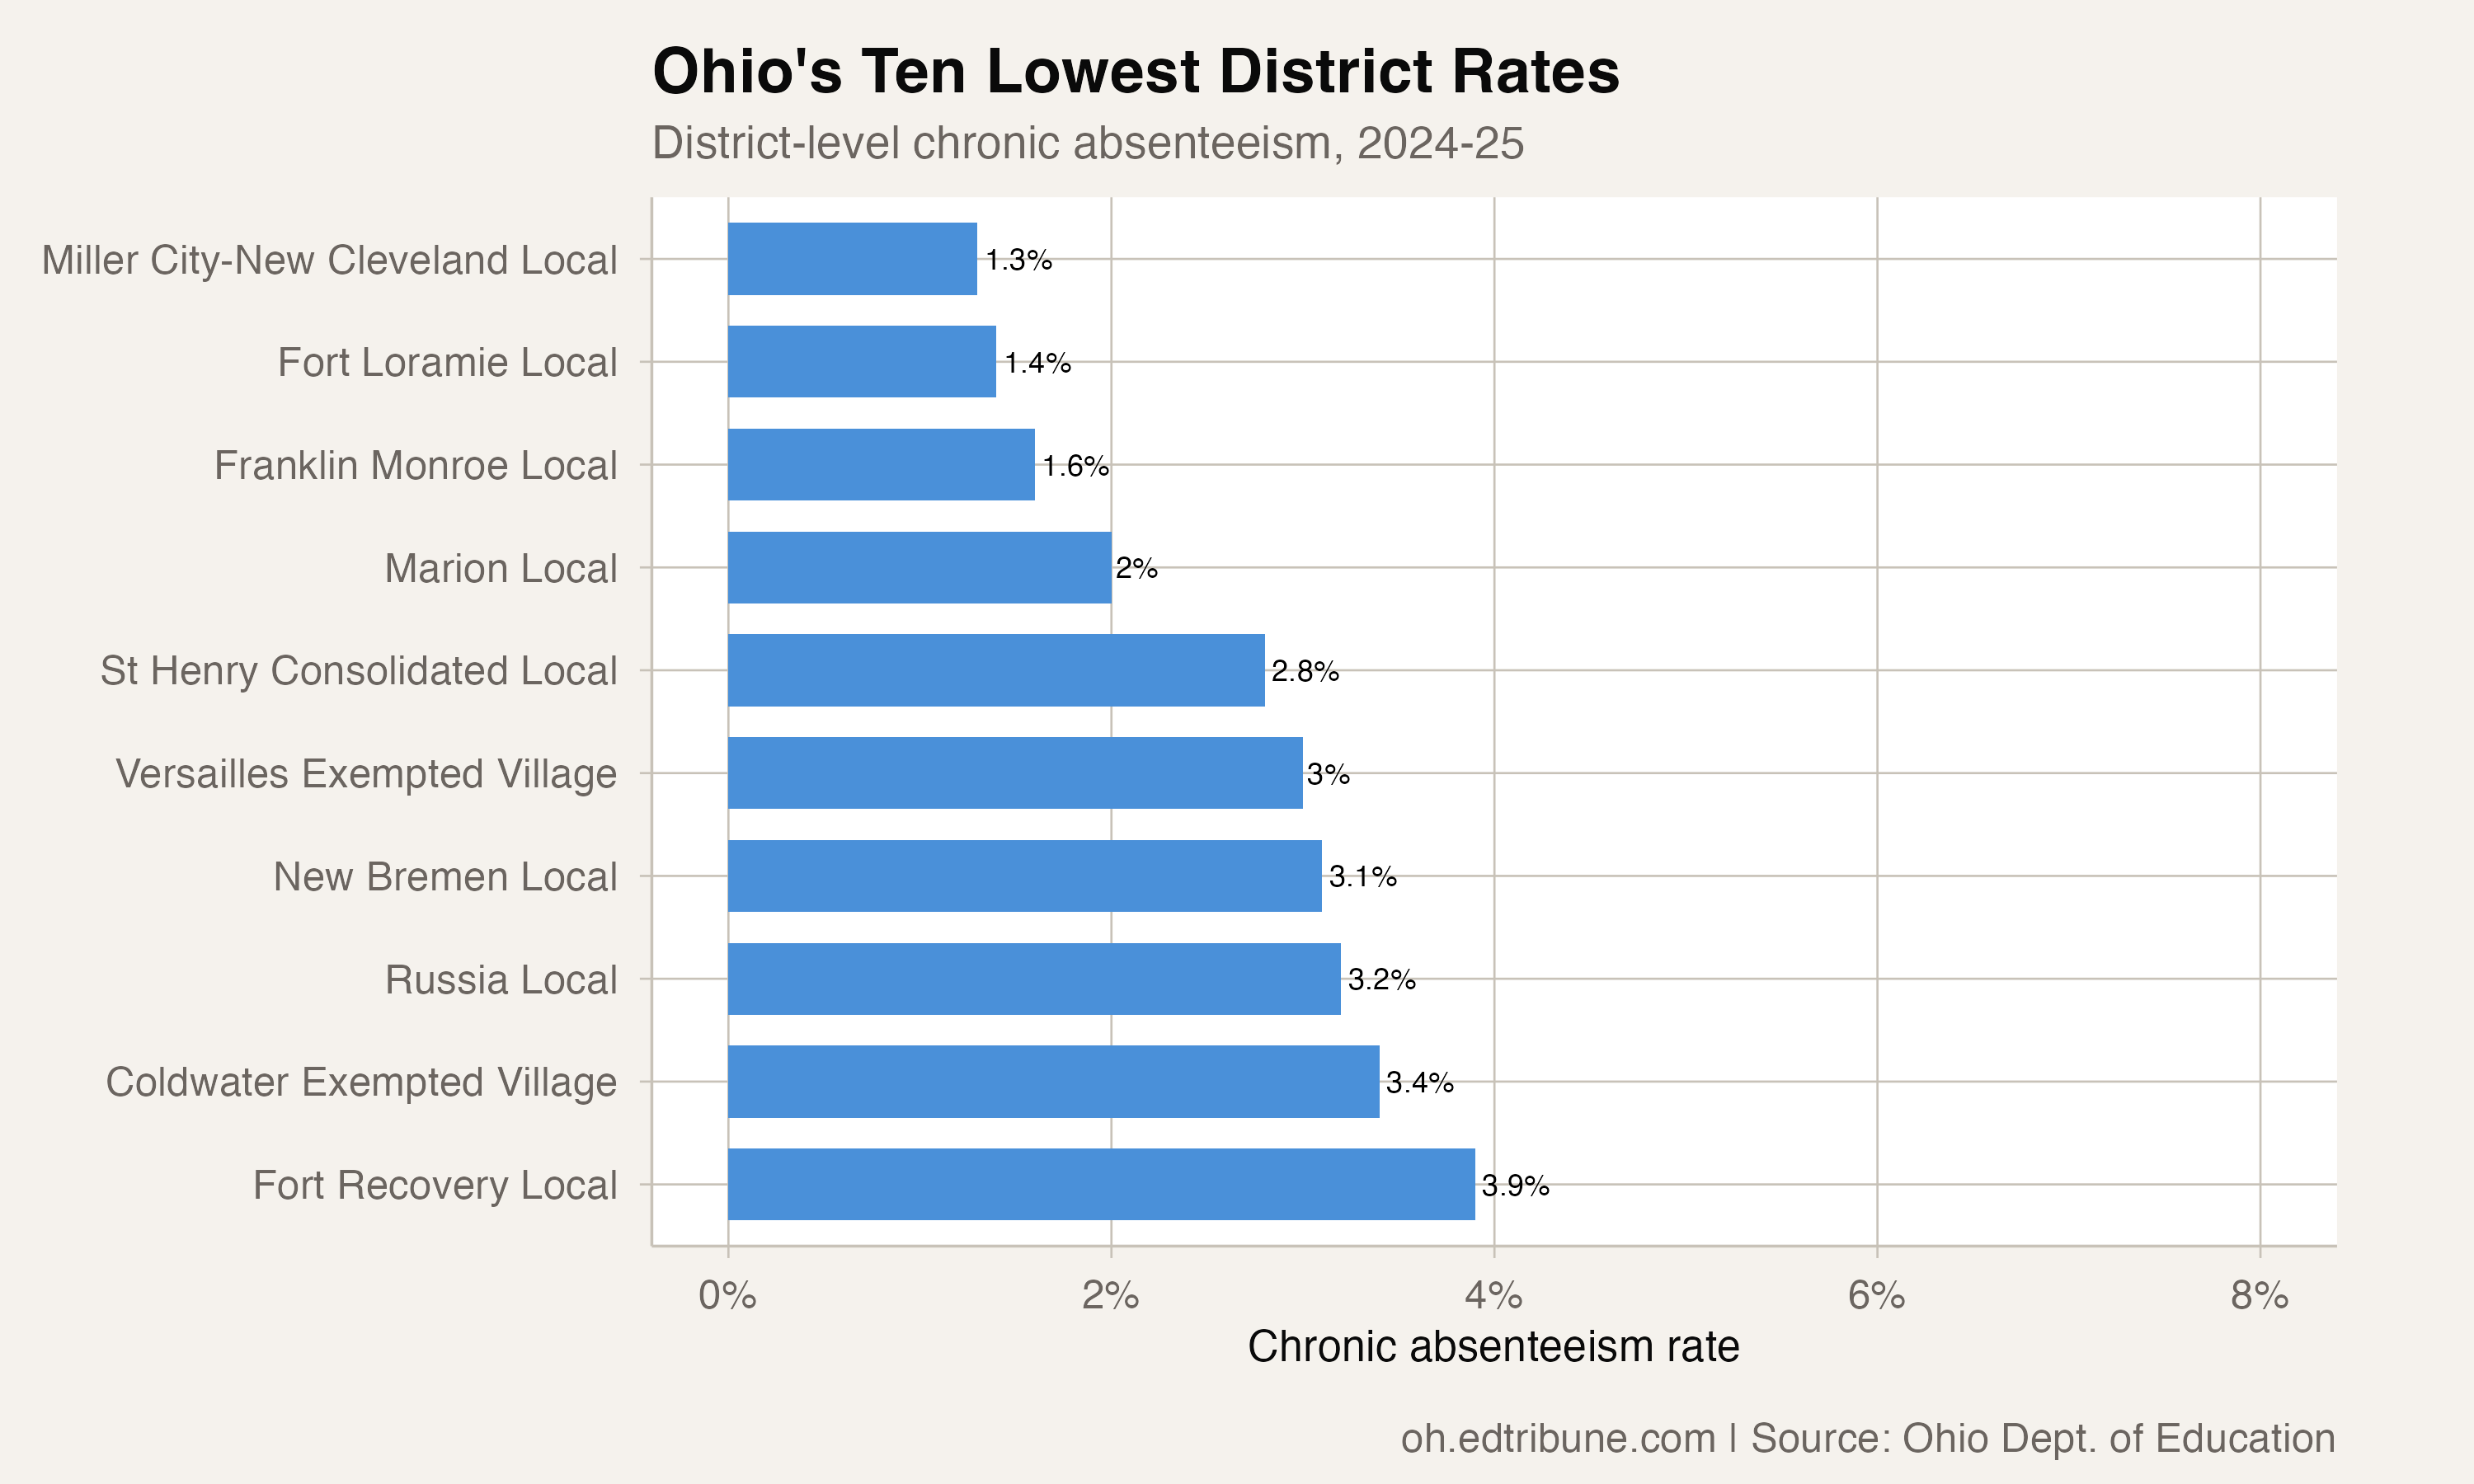
At the district level, the ten lowest 2024-25 rates included districts in Putnam, Mercer, Shelby, Darke, Auglaize and Hancock counties. The complete ranking is shown below.
The highest-rate counties
Meigs had the highest enrollment-weighted county rate at 33.4%, followed by Cuyahoga at 32.1%, Monroe at 31.4%, Hamilton at 31.1% and Ashtabula at 30.9%.
The statewide all-student rate was 25.1% in 2024-25. In the four-year district panel, 313 districts stayed below that 2025 state rate in every year from 2022 through 2025. That is a descriptive threshold comparison, not a claim that those districts had the same rate in each year.
The data shows a geographic spread in reported attendance. It does not say that geography itself caused the spread, and it cannot distinguish among possible explanations without additional evidence.
Detailed code that reproduces the analysis and figures in this article is available exclusively to EdTribune subscribers.
Source
Ohio Department of Education and Workforce, Report Card data downloads.
Discussion
Sign in to join the discussion.
Loading comments...