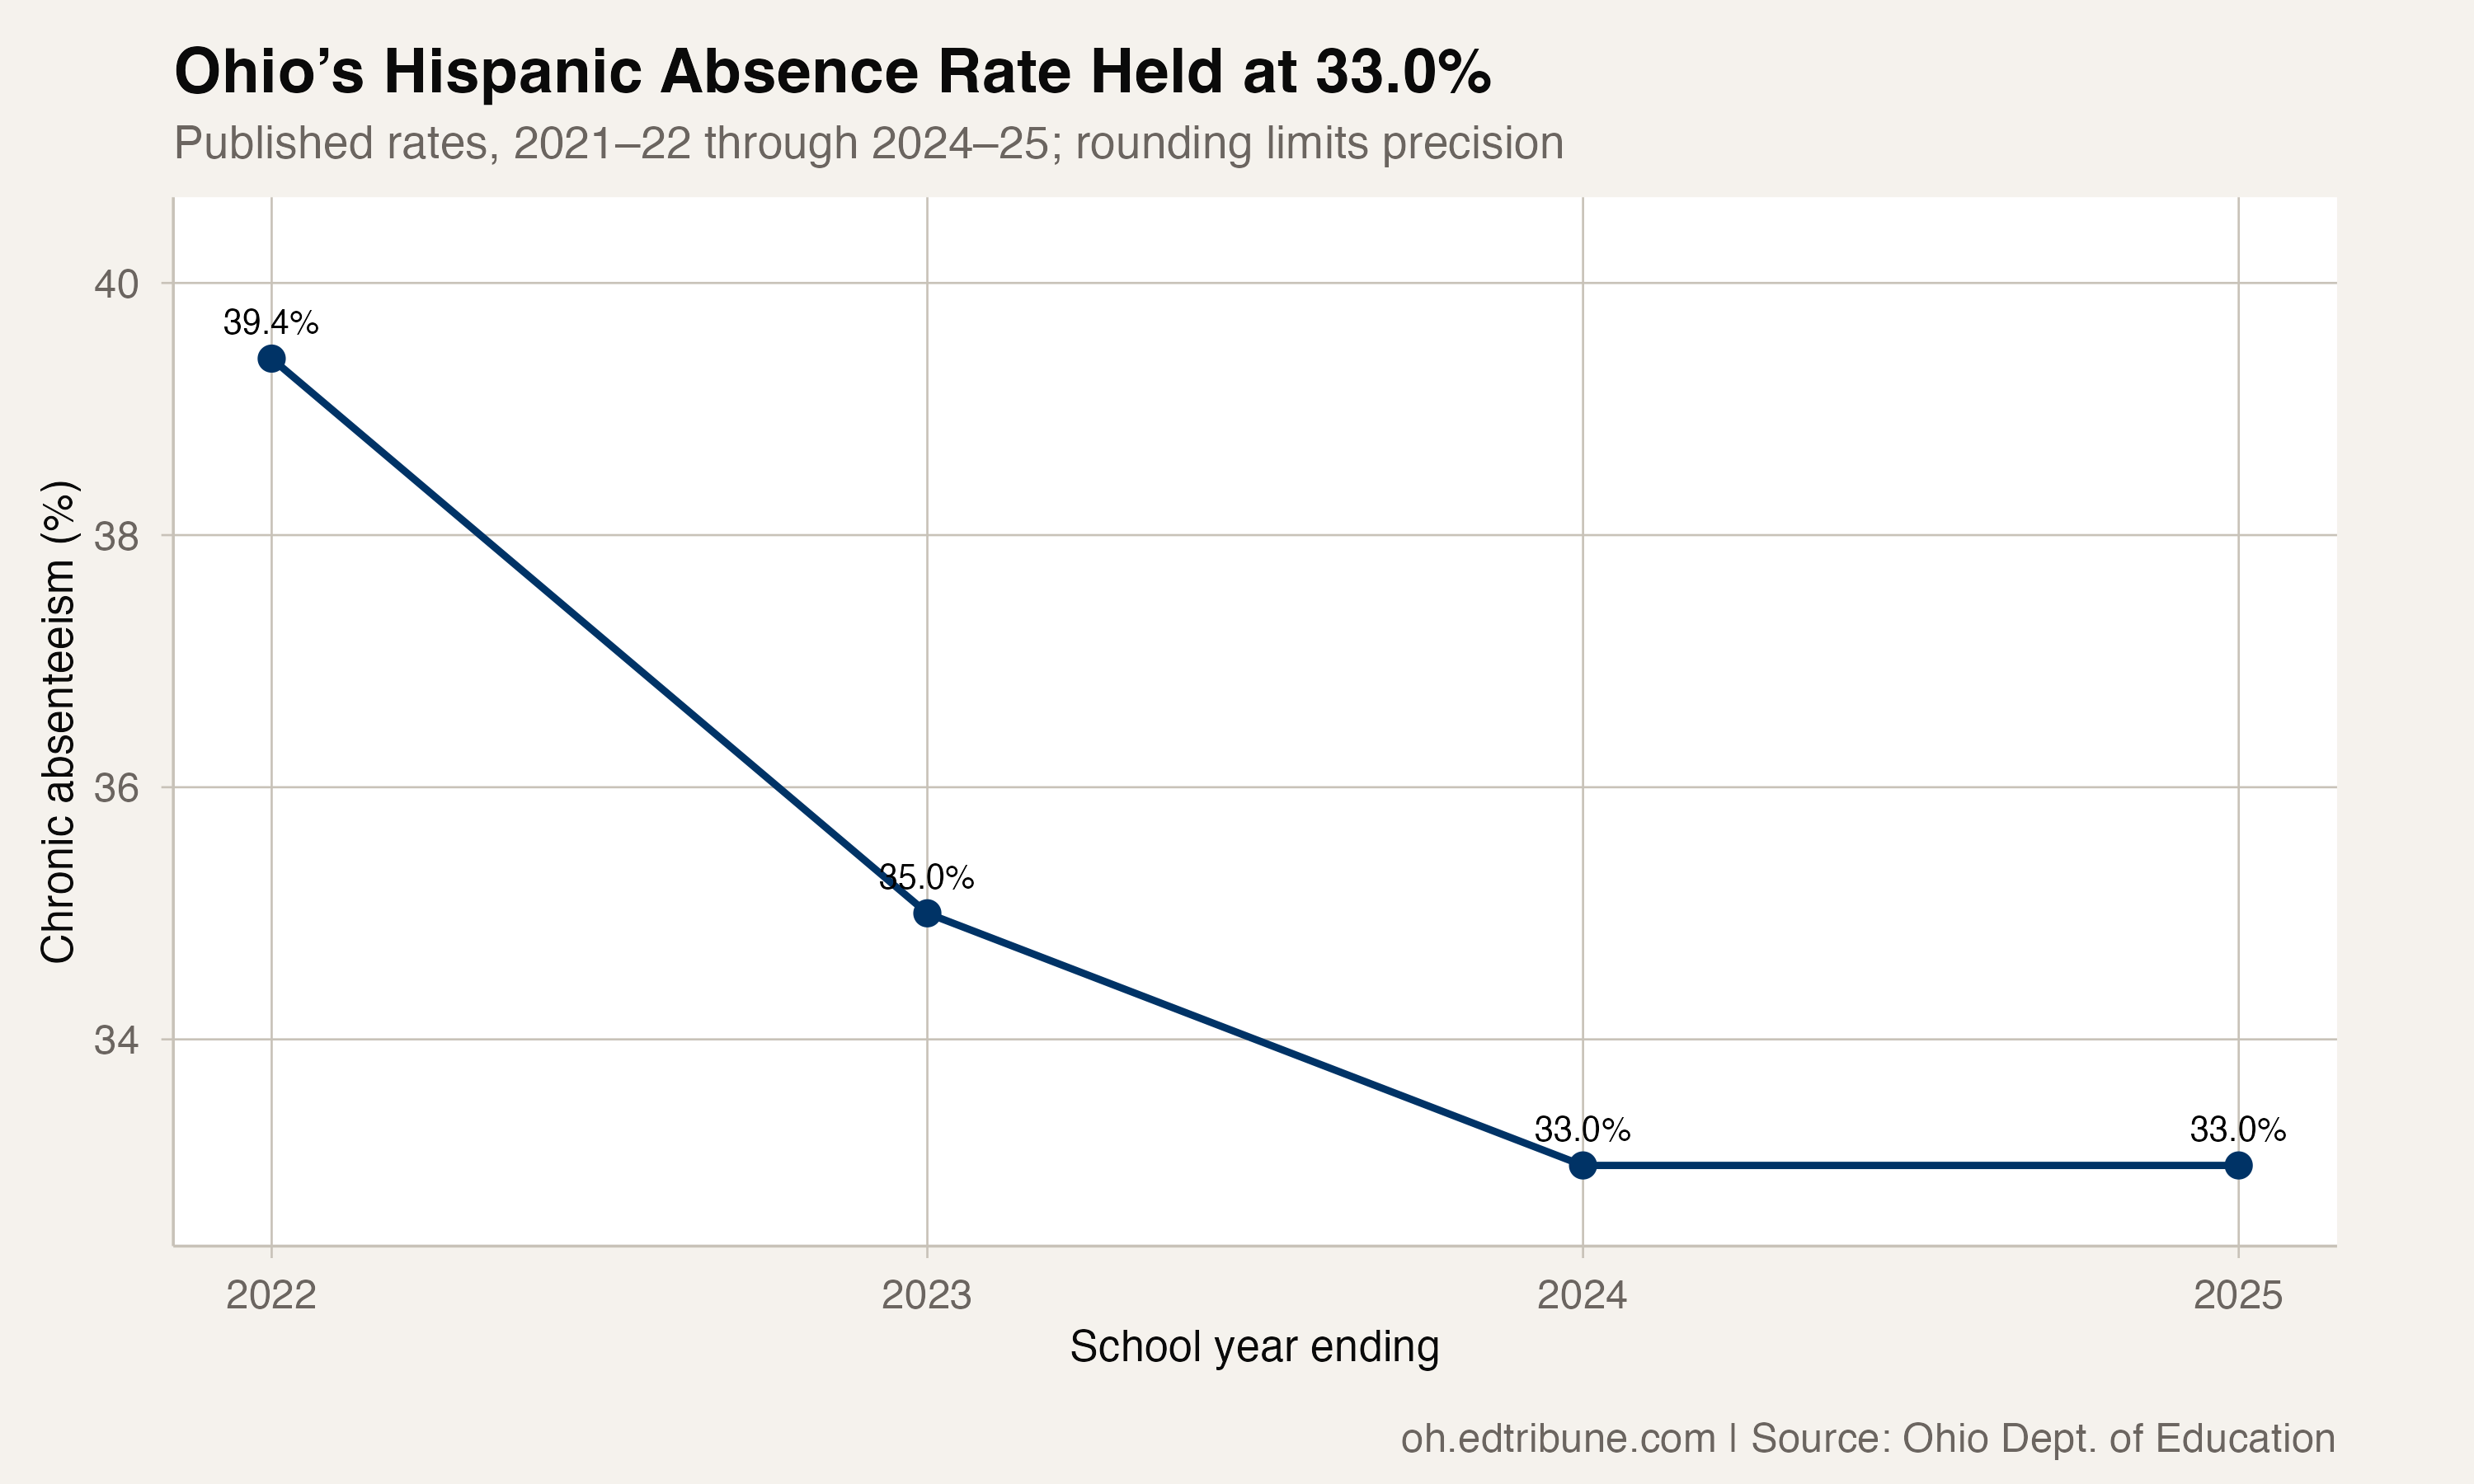
Ohio reported a chronic-absence rate of 33.0% for Hispanic students in both 2023-24 and 2024-25. Last school year’s published figure showed no improvement at the precision reported by the state, even as several other student groups recorded lower rates.
That is a pause in the published series, not proof that attendance was unchanged to every decimal place. The state reports rounded rates. The most recent observations used here describe 2024-25 rather than students’ attendance during the current school year.
A lower rate than at the start, then a pause
The Hispanic rate was 39.4% in 2021-22. By 2024-25, it was 6.4 percentage points lower. The earlier declines therefore remain part of the story, even though the last annual comparison showed the same published rate.
An unchanged rounded rate does not mean that the same children were chronically absent in consecutive years. These are annual subgroup populations, and the statewide table does not follow individual students between reporting years. It also does not say why the rate held steady.
Subgroup changes were uneven
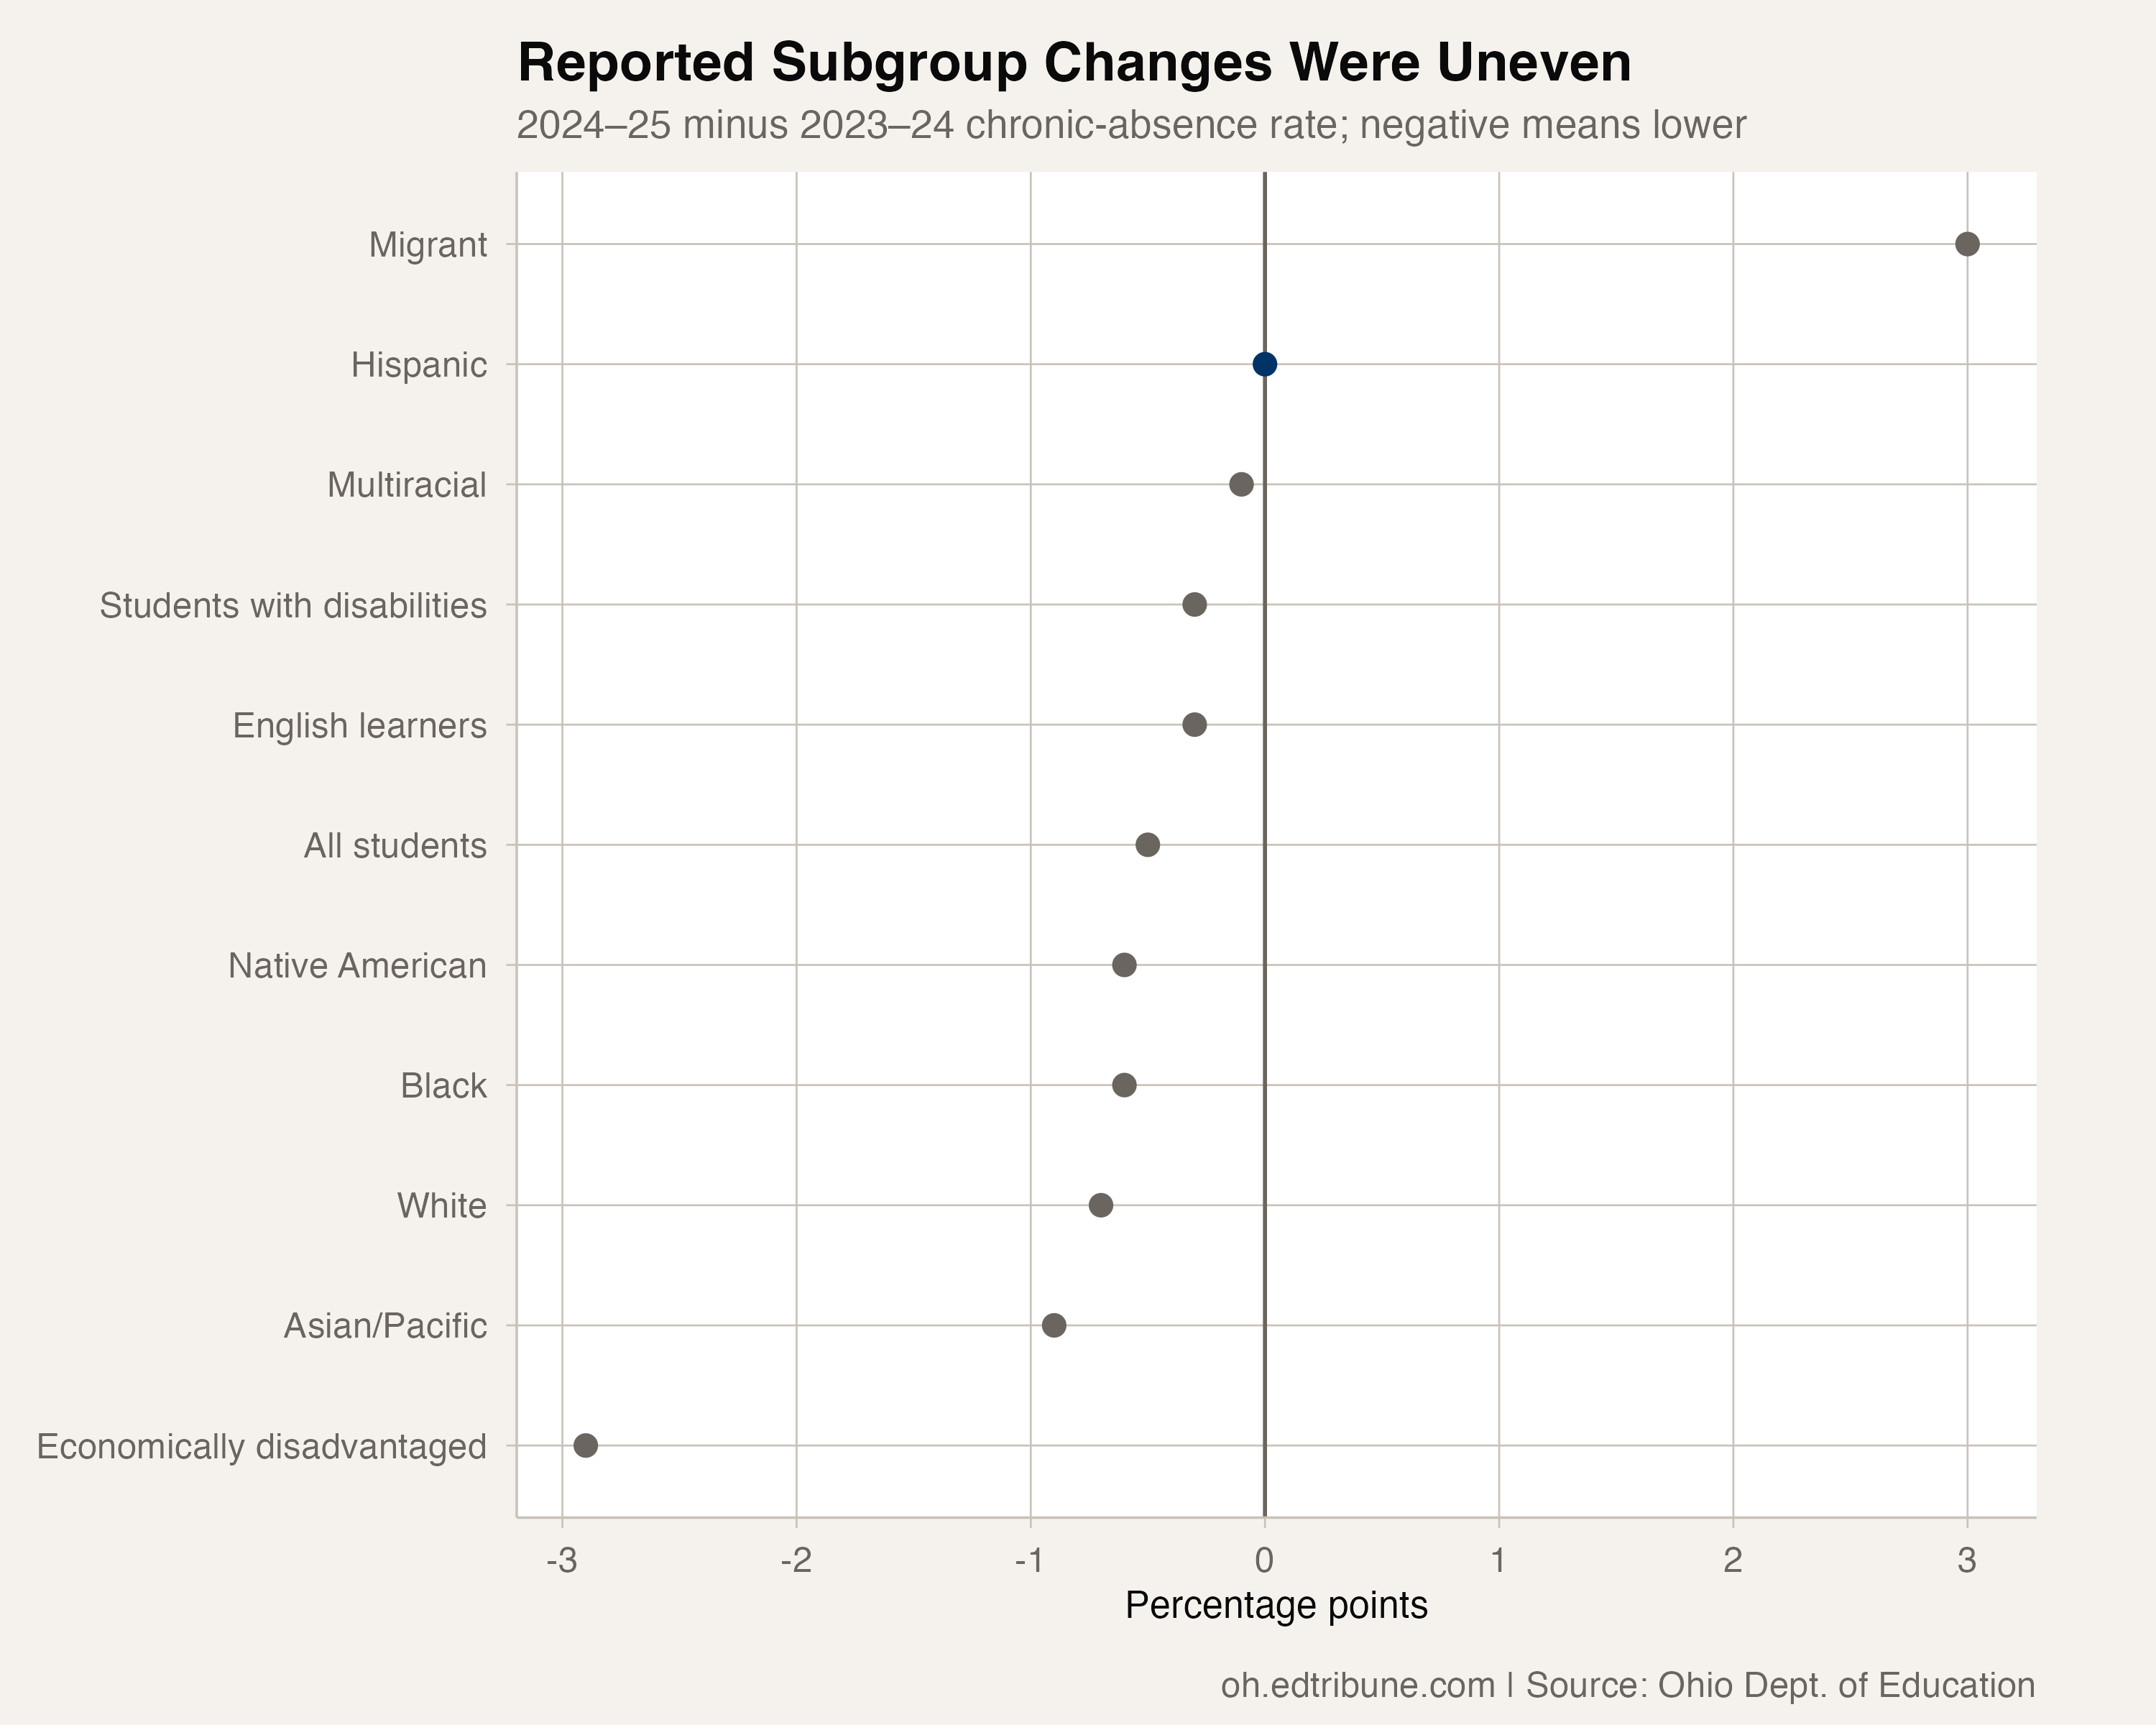
Ohio’s all-student rate fell by 0.5 percentage points in the latest annual comparison, reaching 25.1%. The White-student rate fell by 0.7 points and the Black-student rate by 0.6 points. Rates also fell for students with disabilities and English learners.
Improvement was not universal. The migrant-student rate rose by 3.0 points, reaching 26.0%. The Hispanic rate was unchanged at the state’s published precision. Showing every reported statewide subgroup in the chart avoids treating a selected set of improving groups as the whole picture.
The latest Hispanic rate was 13.9 points above the White-student rate. That difference describes the published attendance outcomes of the groups; it does not identify the reasons behind them. Subgroup categories can overlap, so their student counts should not be added together as if each row represented a separate population.
The recorded population grew
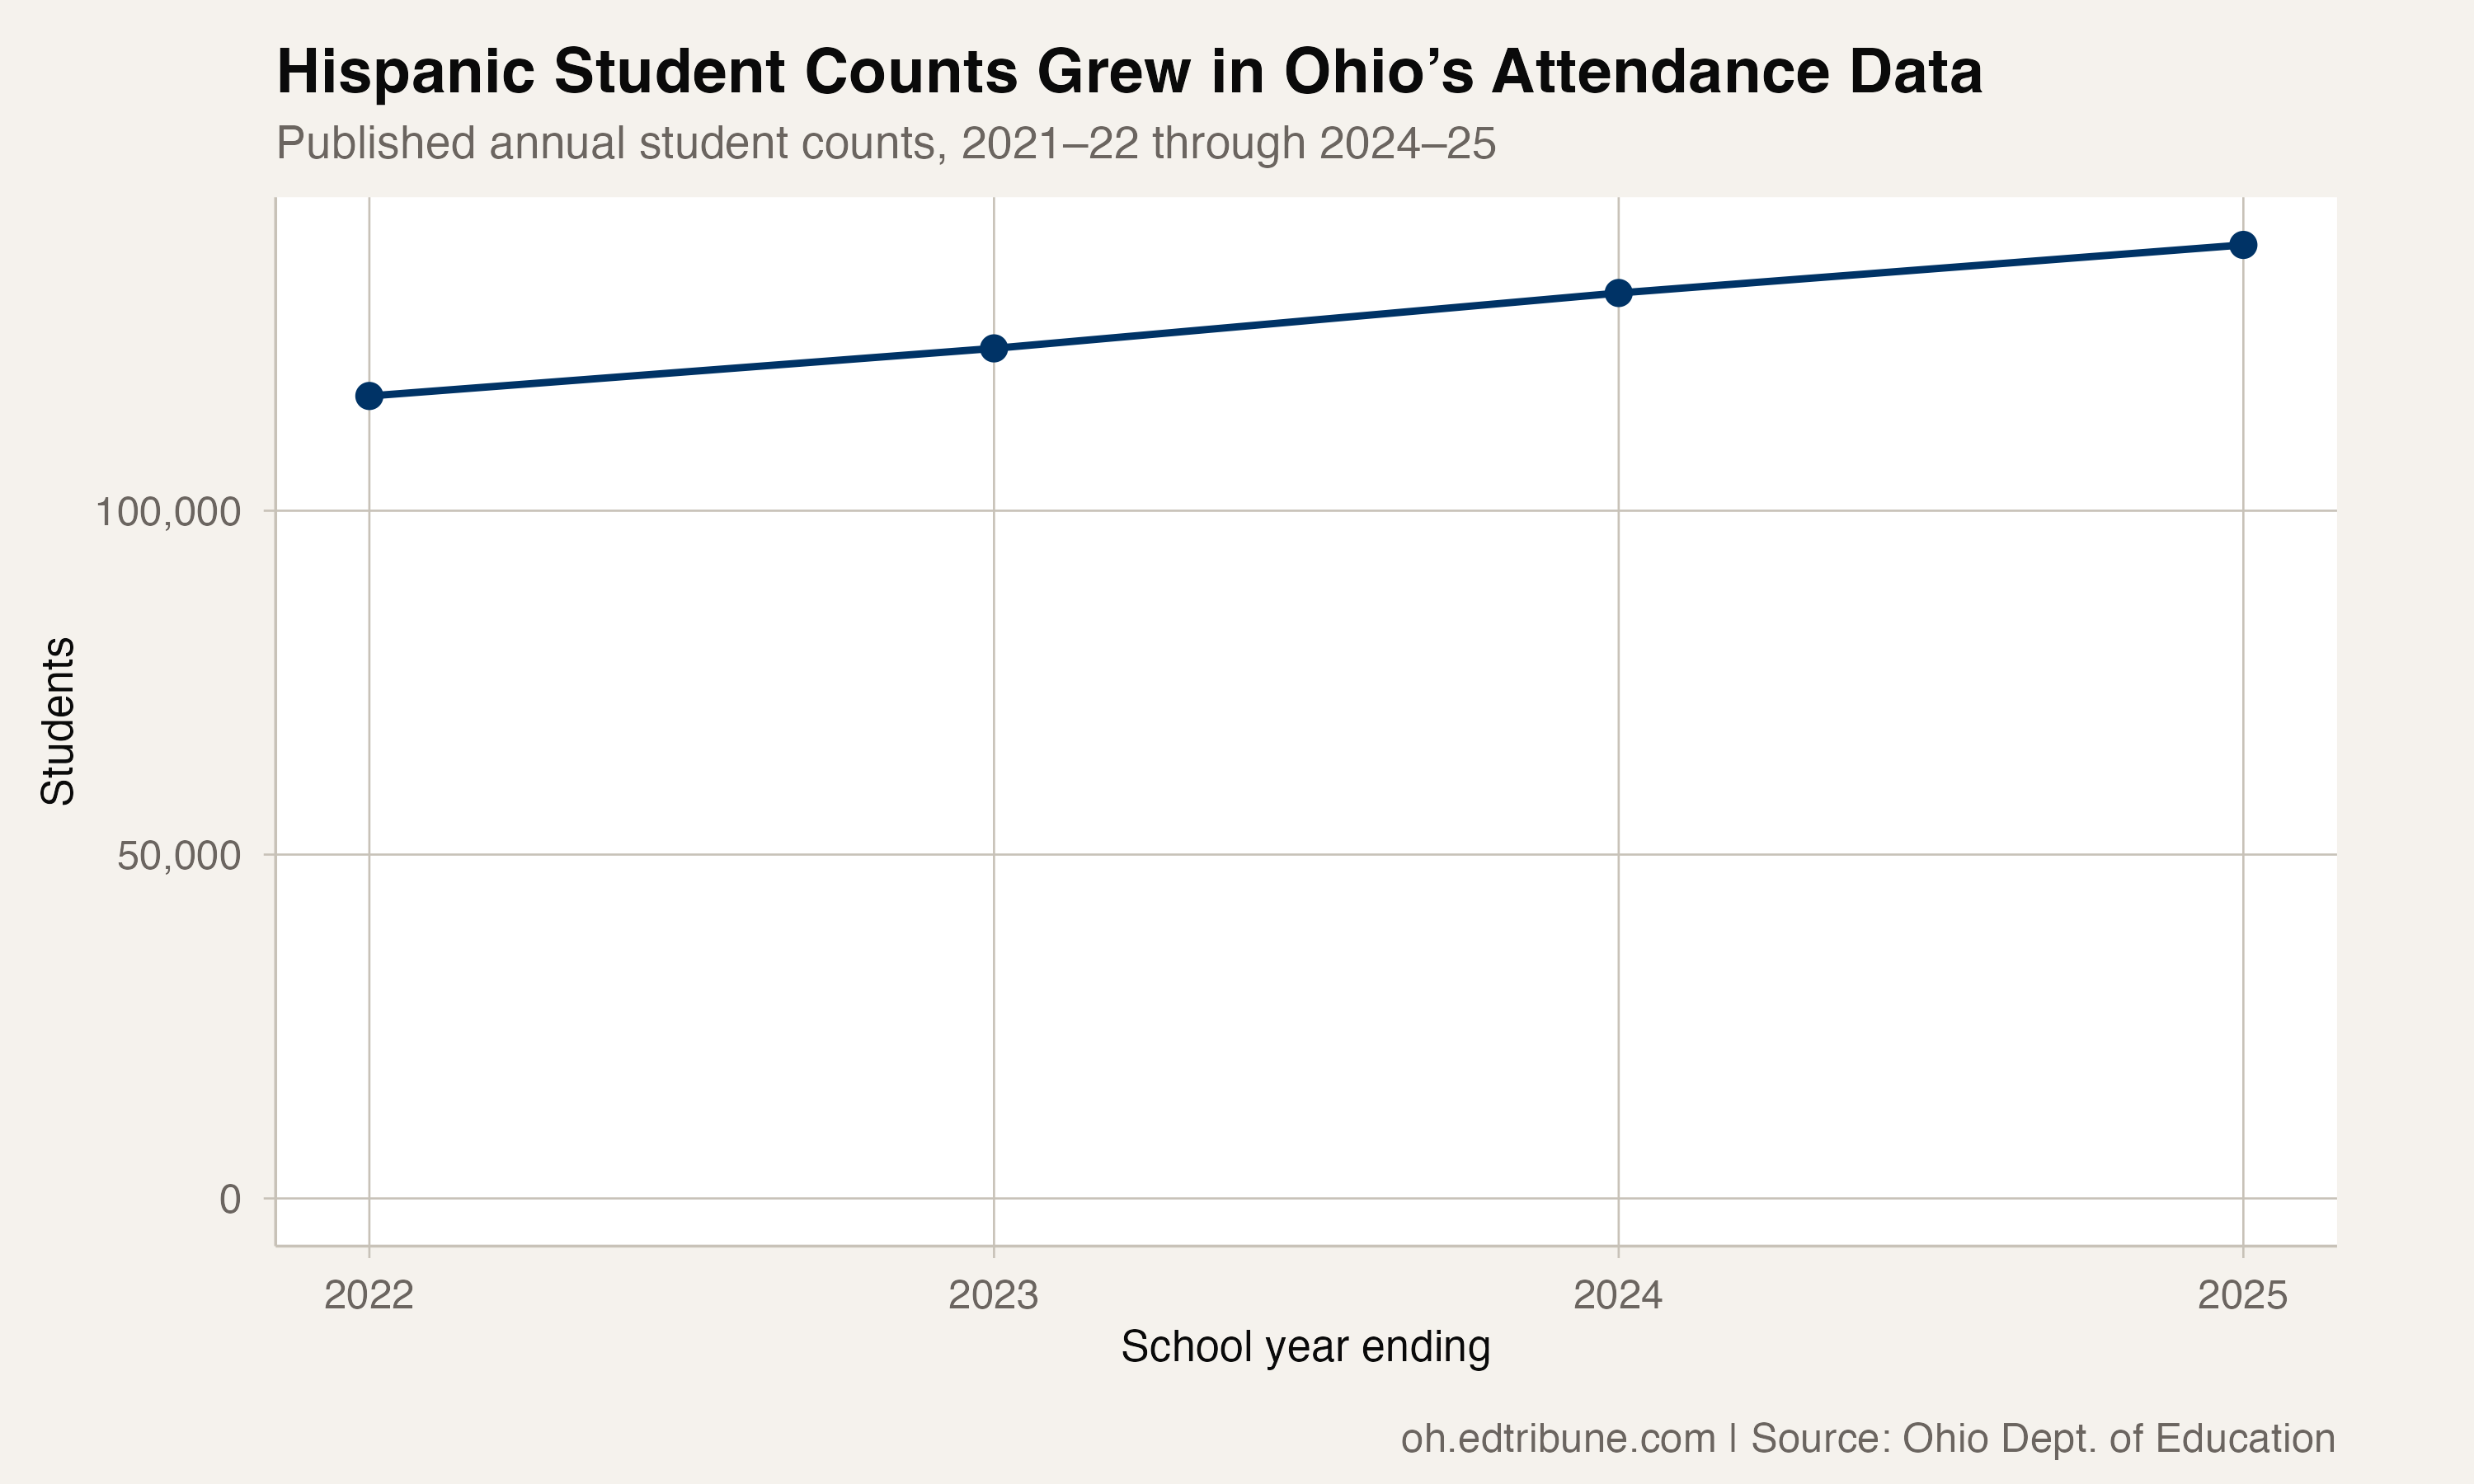
The statewide Hispanic attendance table recorded 116,683 students in 2021-22 and 138,648 in 2024-25, an increase of 21,965. Those figures are the student counts in the attendance table, rather than a projection of future enrollment.
Multiplying a rounded rate by the recorded population would produce an estimate, not a published count of chronically absent students. This analysis does not substitute such an estimate for a count the table does not supply.
The supported finding is that the published Hispanic rate remained above Ohio’s all-student rate and stopped falling in the latest annual comparison. Whether that pause continues, and which local responses help students attend more consistently, requires later observations and evidence beyond this statewide table.
Detailed code that reproduces the analysis and figures in this article is available exclusively to EdTribune subscribers.
Discussion
Sign in to join the discussion.
Loading comments...