Correction: This article was updated September 11, 2026, to correct its district rates, range, comparison, and supporting evidence.
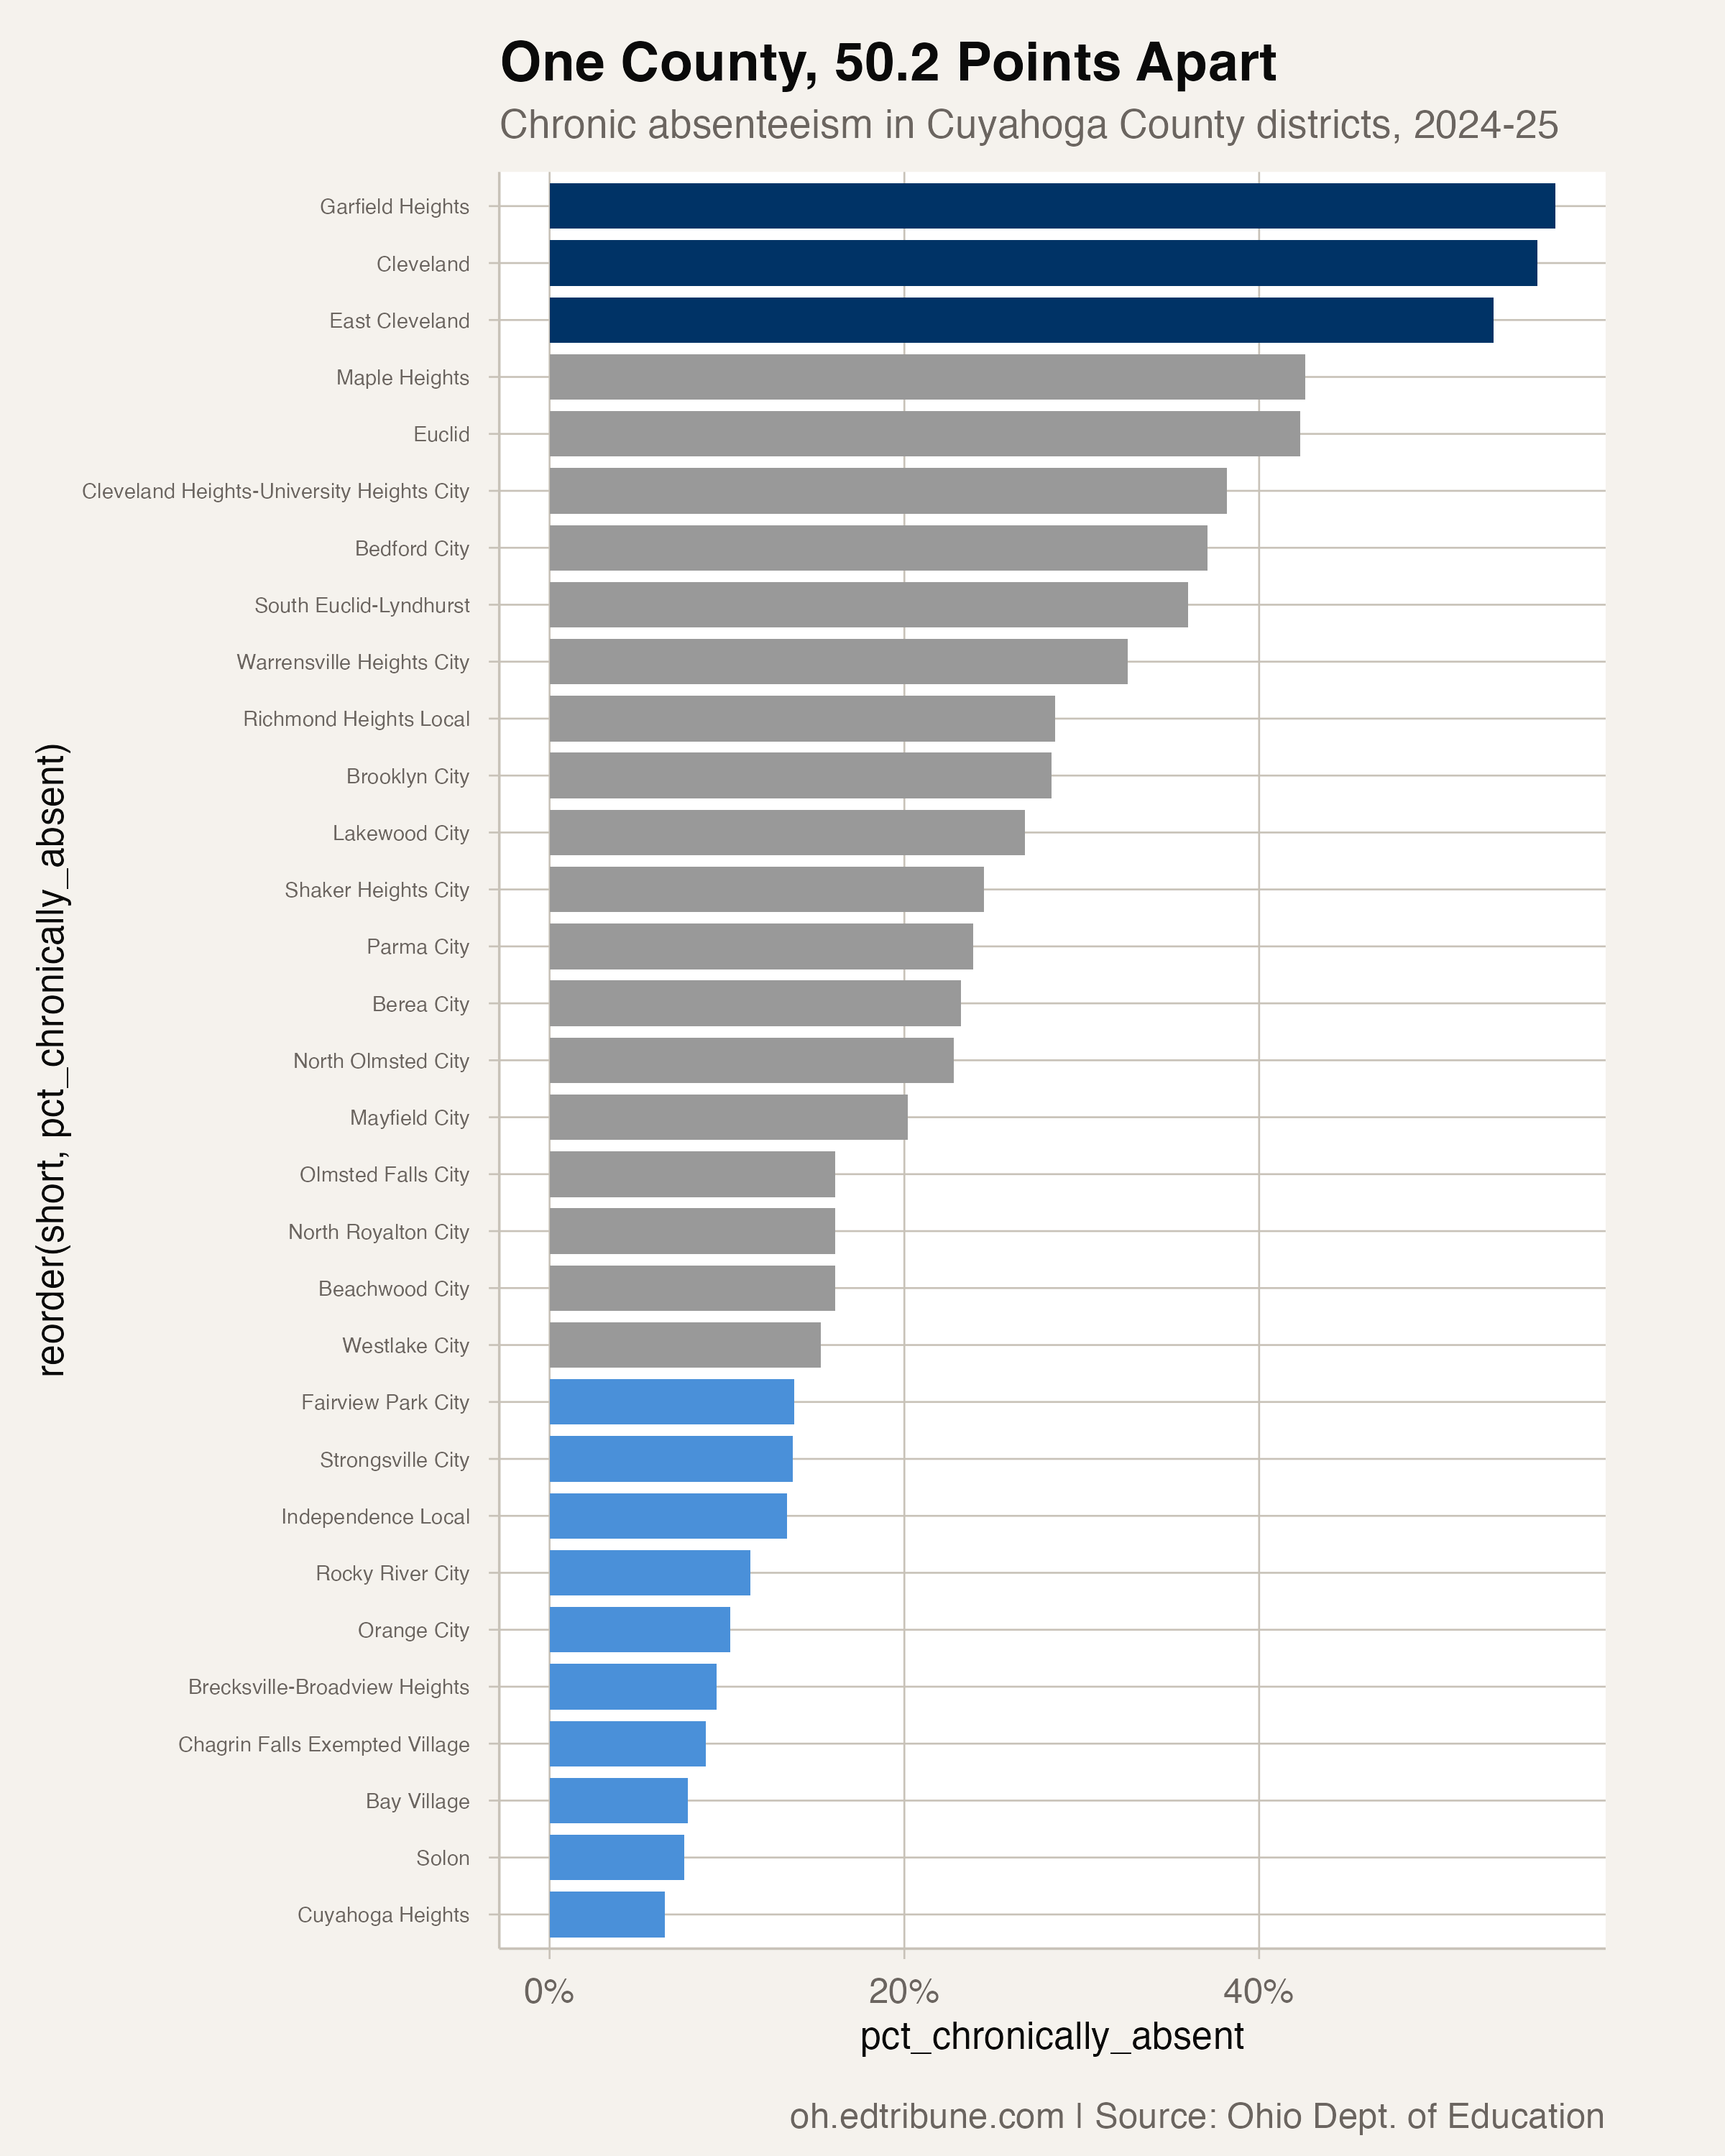
Cuyahoga County's 31 school districts reported chronic absenteeism rates from 6.5% to 56.7% in 2024-25, the most recent year in the Ohio attendance panel. The 50.2-point spread is the difference between Cuyahoga Heights Local↗ET and Garfield Heights City Schools↗ET. The highest rate was 8.7 times the lowest.
The county's published-enrollment-weighted rate was 32.1%, compared with 25.1% statewide. The district rows behind the county calculation represented 126,151 students. That county average gives useful scale, but it does not describe the range facing individual districts.
The lower end of the range
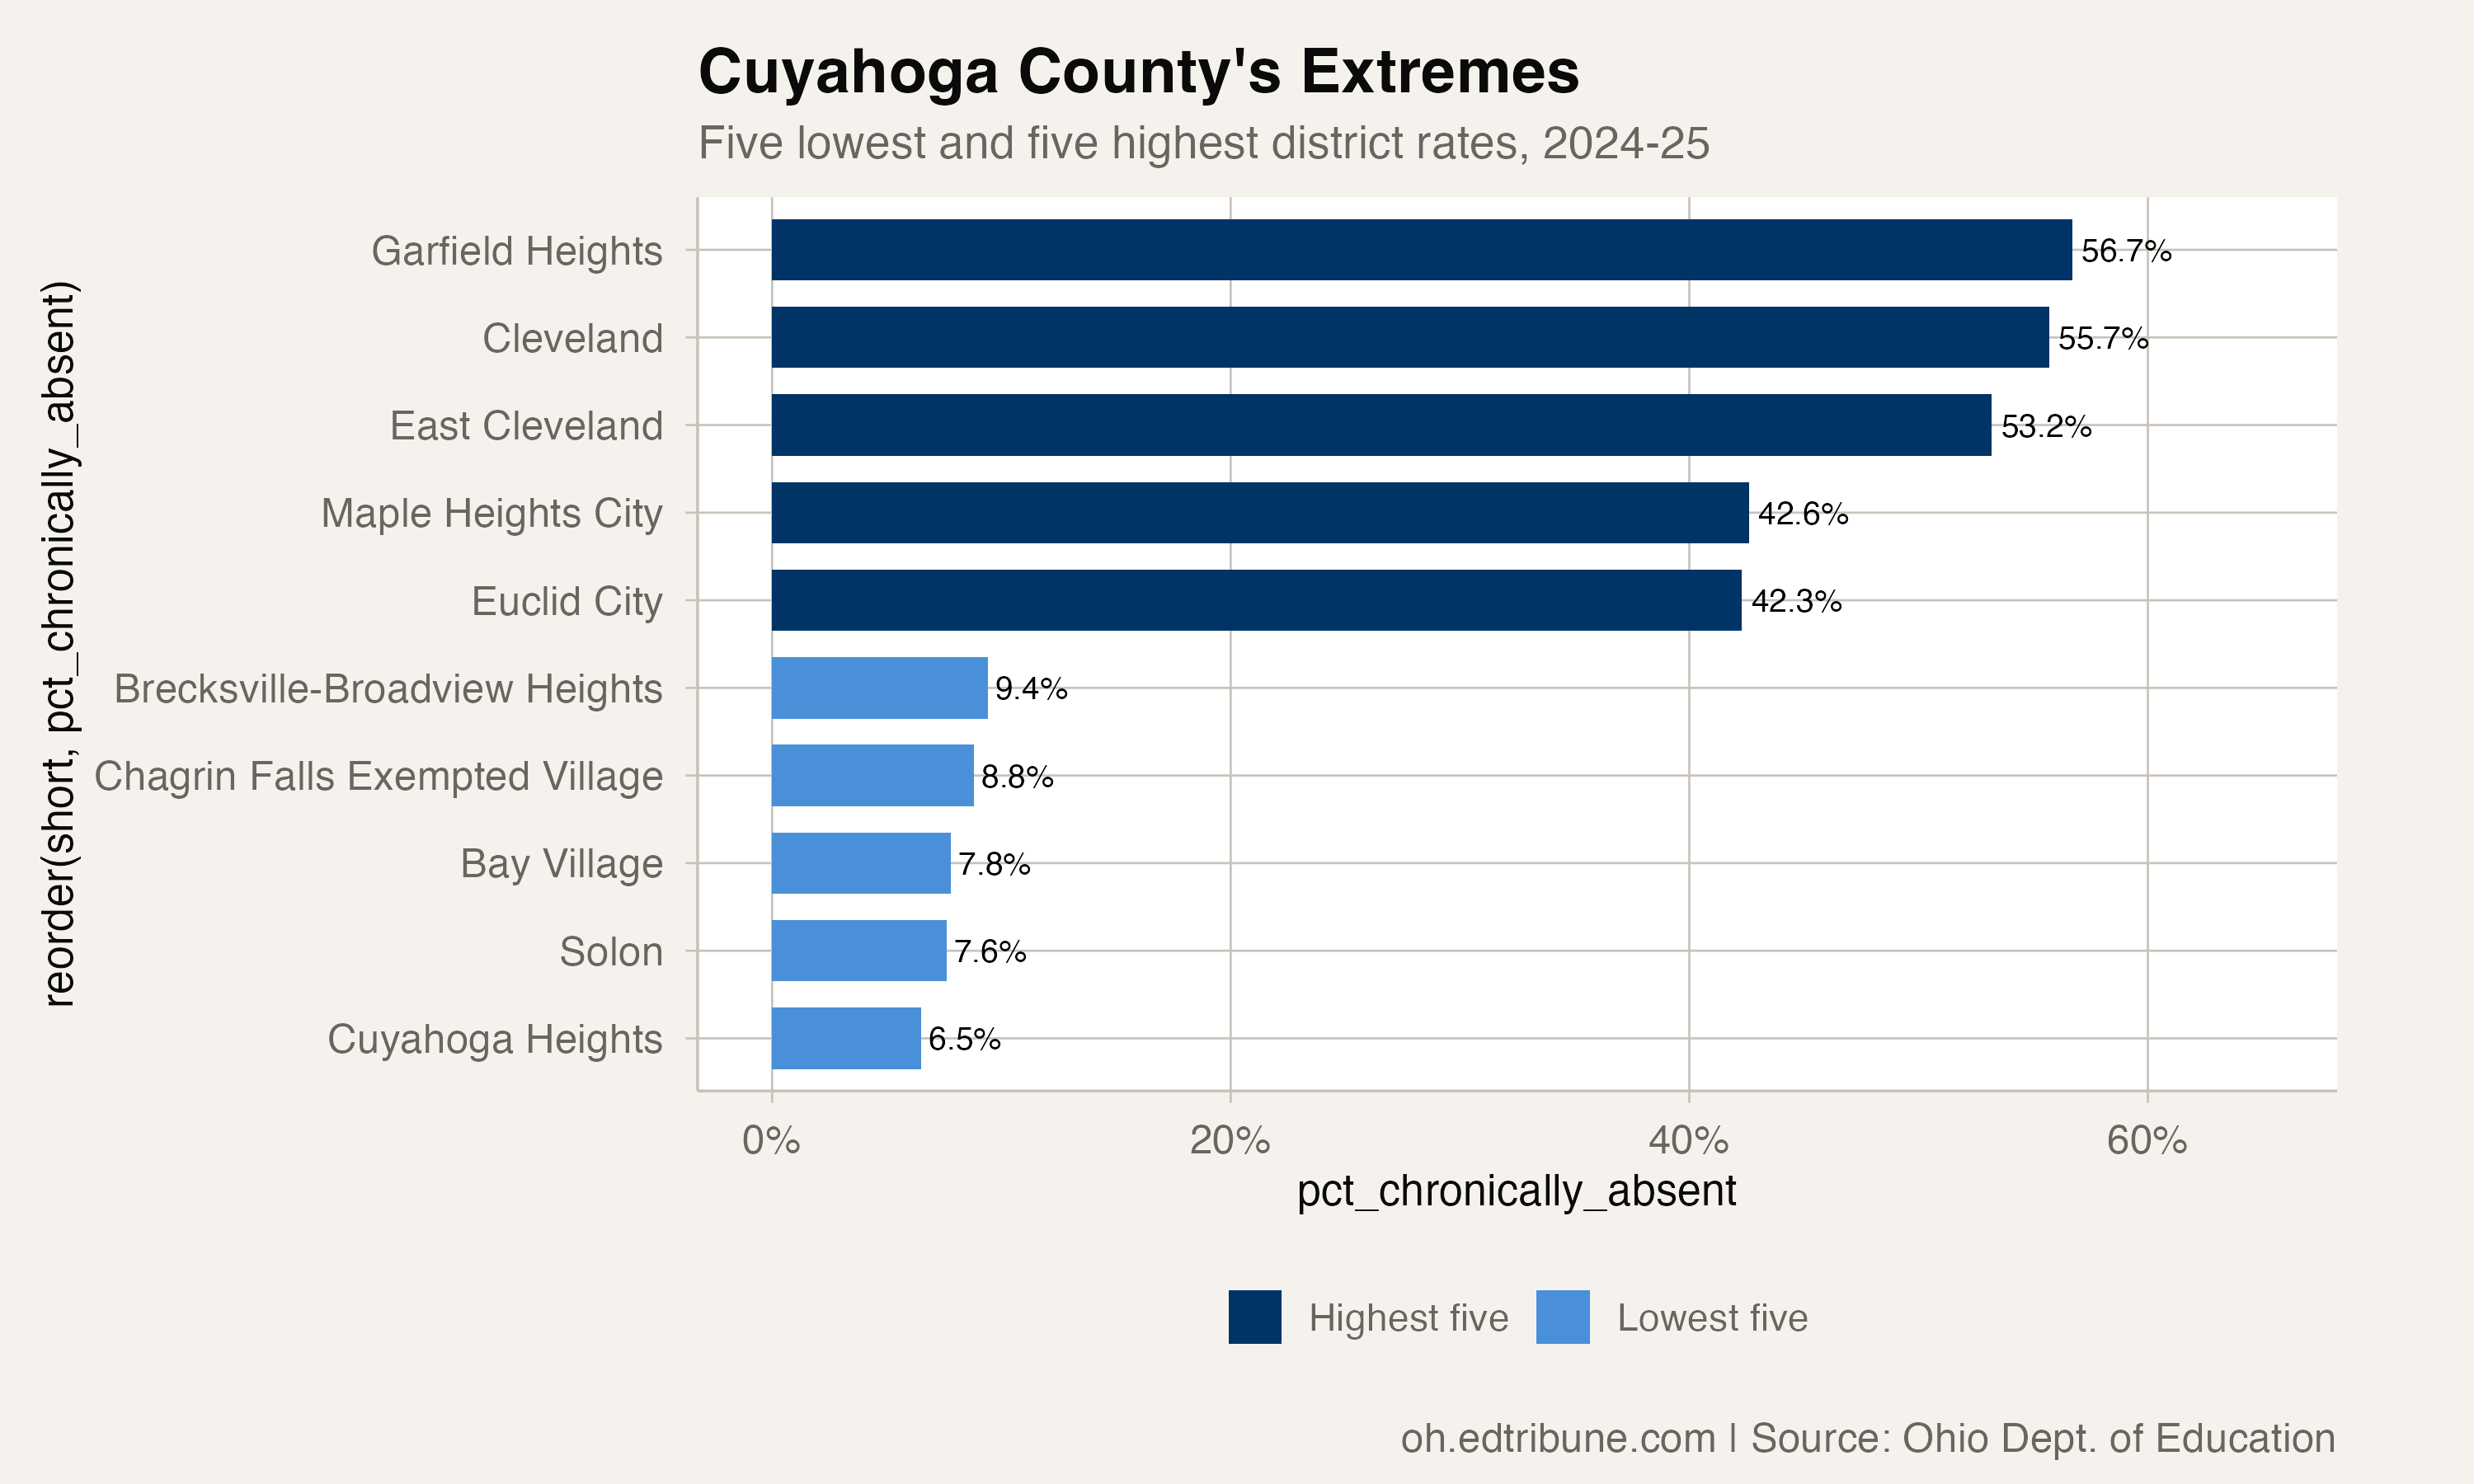
Cuyahoga Heights Local reported the county's lowest rate at 6.5%. Solon City↗ET was next at 7.6%, followed by Bay Village City↗ET at 7.8% and Brecksville-Broadview Heights City↗ET at 9.4%. Those rates were below Ohio's 25.1% statewide figure.
The middle of the distribution was broad. Parma City reported 23.9%, just below the state rate. Lakewood City was at 26.8%, while South Euclid-Lyndhurst City↗ET was at 36.0%. Euclid City↗ET and Maple Heights City↗ET were higher still, at 42.3% and 42.6%.
The upper end included Cleveland Municipal↗ET at 55.7%, East Cleveland City School District↗ET at 53.2% and Garfield Heights City Schools at 56.7%. The numbers show a countywide spread; they do not identify why one district's rate differs from another's or imply that a district boundary causes the outcome.
One pair, four reporting years
The gap between Solon and Garfield Heights was already large in the first year of the available comparison. In 2021-22, Solon's rate was 12.6% and Garfield Heights' was 56.9%, a 44.3-point difference.
By 2024-25, Solon had moved down to 7.6%, a 5.0-point improvement. Garfield Heights was at 56.7%, only 0.2 points below its 2021-22 rate. The difference between the two districts had widened to 49.1 points, up 4.8 points from the earlier comparison.
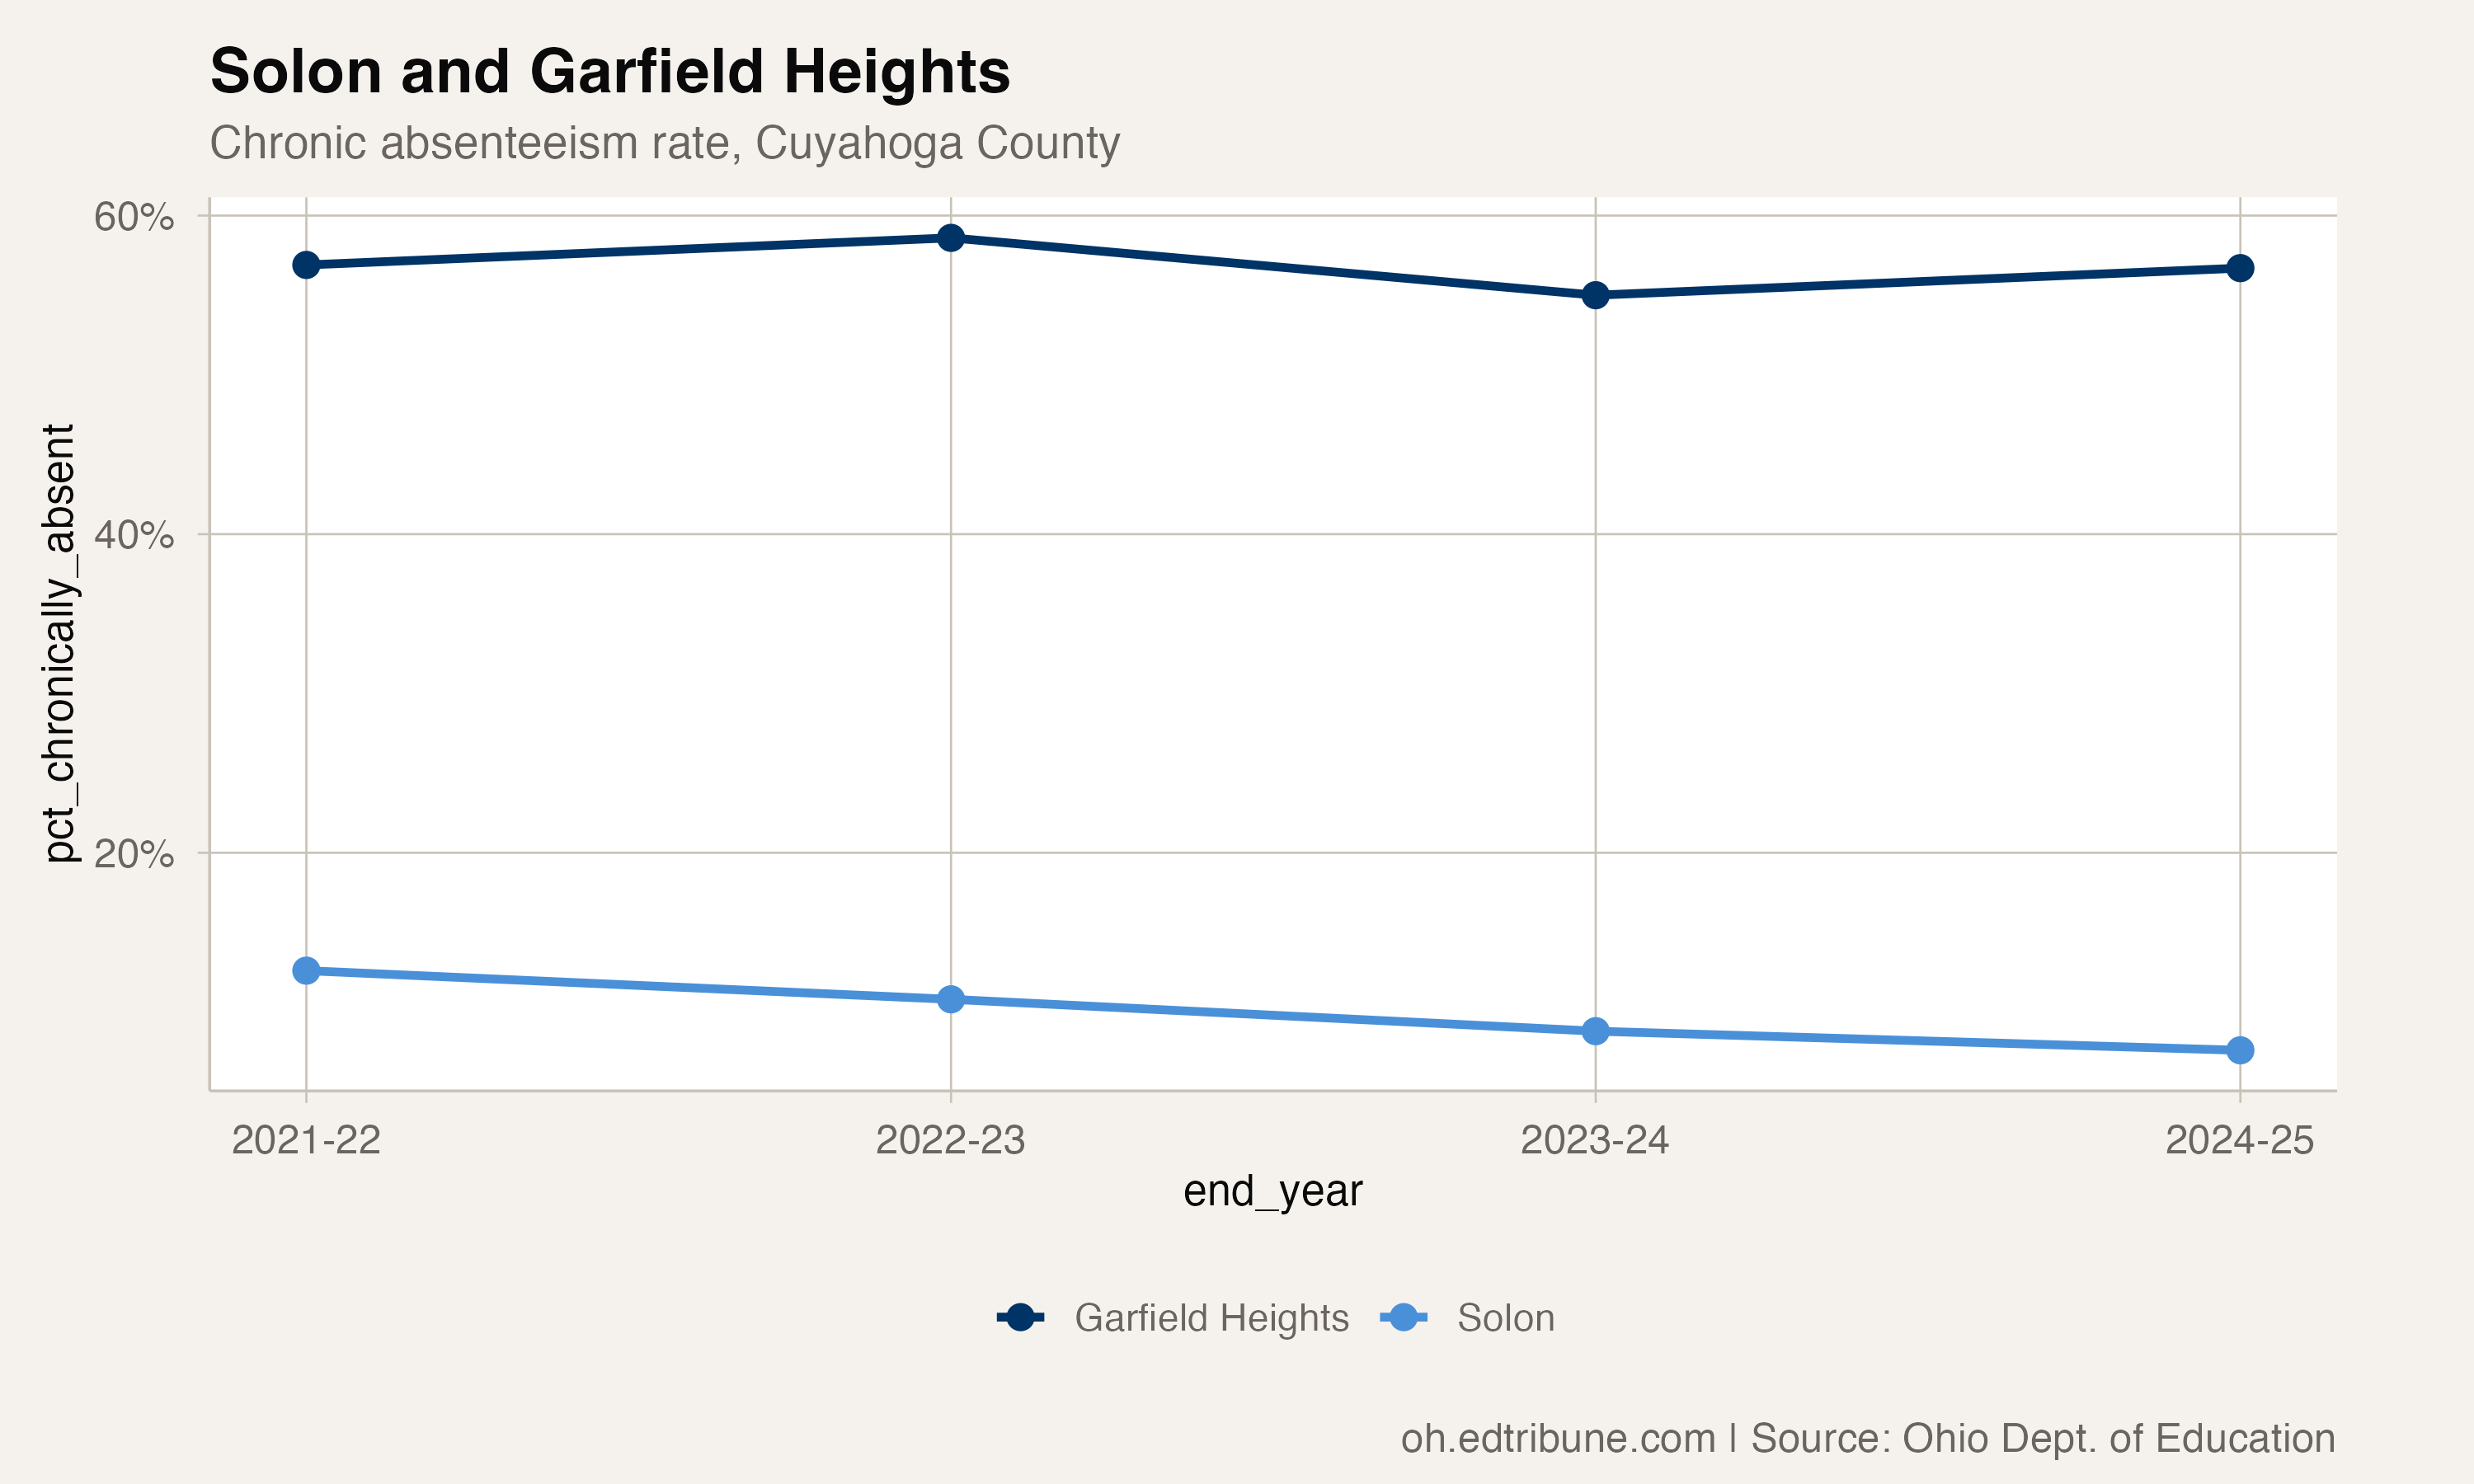
The comparison is descriptive, not a diagnosis. The Ohio attendance data can show where rates were highest, lowest and changing across the reporting panel. It does not include the local information needed to assign a cause to the gap.
For district leaders, the practical starting point is the same in every countywide comparison: keep the published denominator visible, compare like reporting years and examine the individual district pattern instead of relying on a single county average. In Cuyahoga County, that pattern runs from 6.5% to 56.7% across 31 districts.
Chronic absenteeism rates and published enrollment denominators come from the Ohio Department of Education and Workforce's Ohio School Report Card download files, covering the 2021-22 through 2024-25 school years.
Detailed code that reproduces the analysis and figures in this article is available exclusively to EdTribune subscribers.
Discussion
Sign in to join the discussion.
Loading comments...