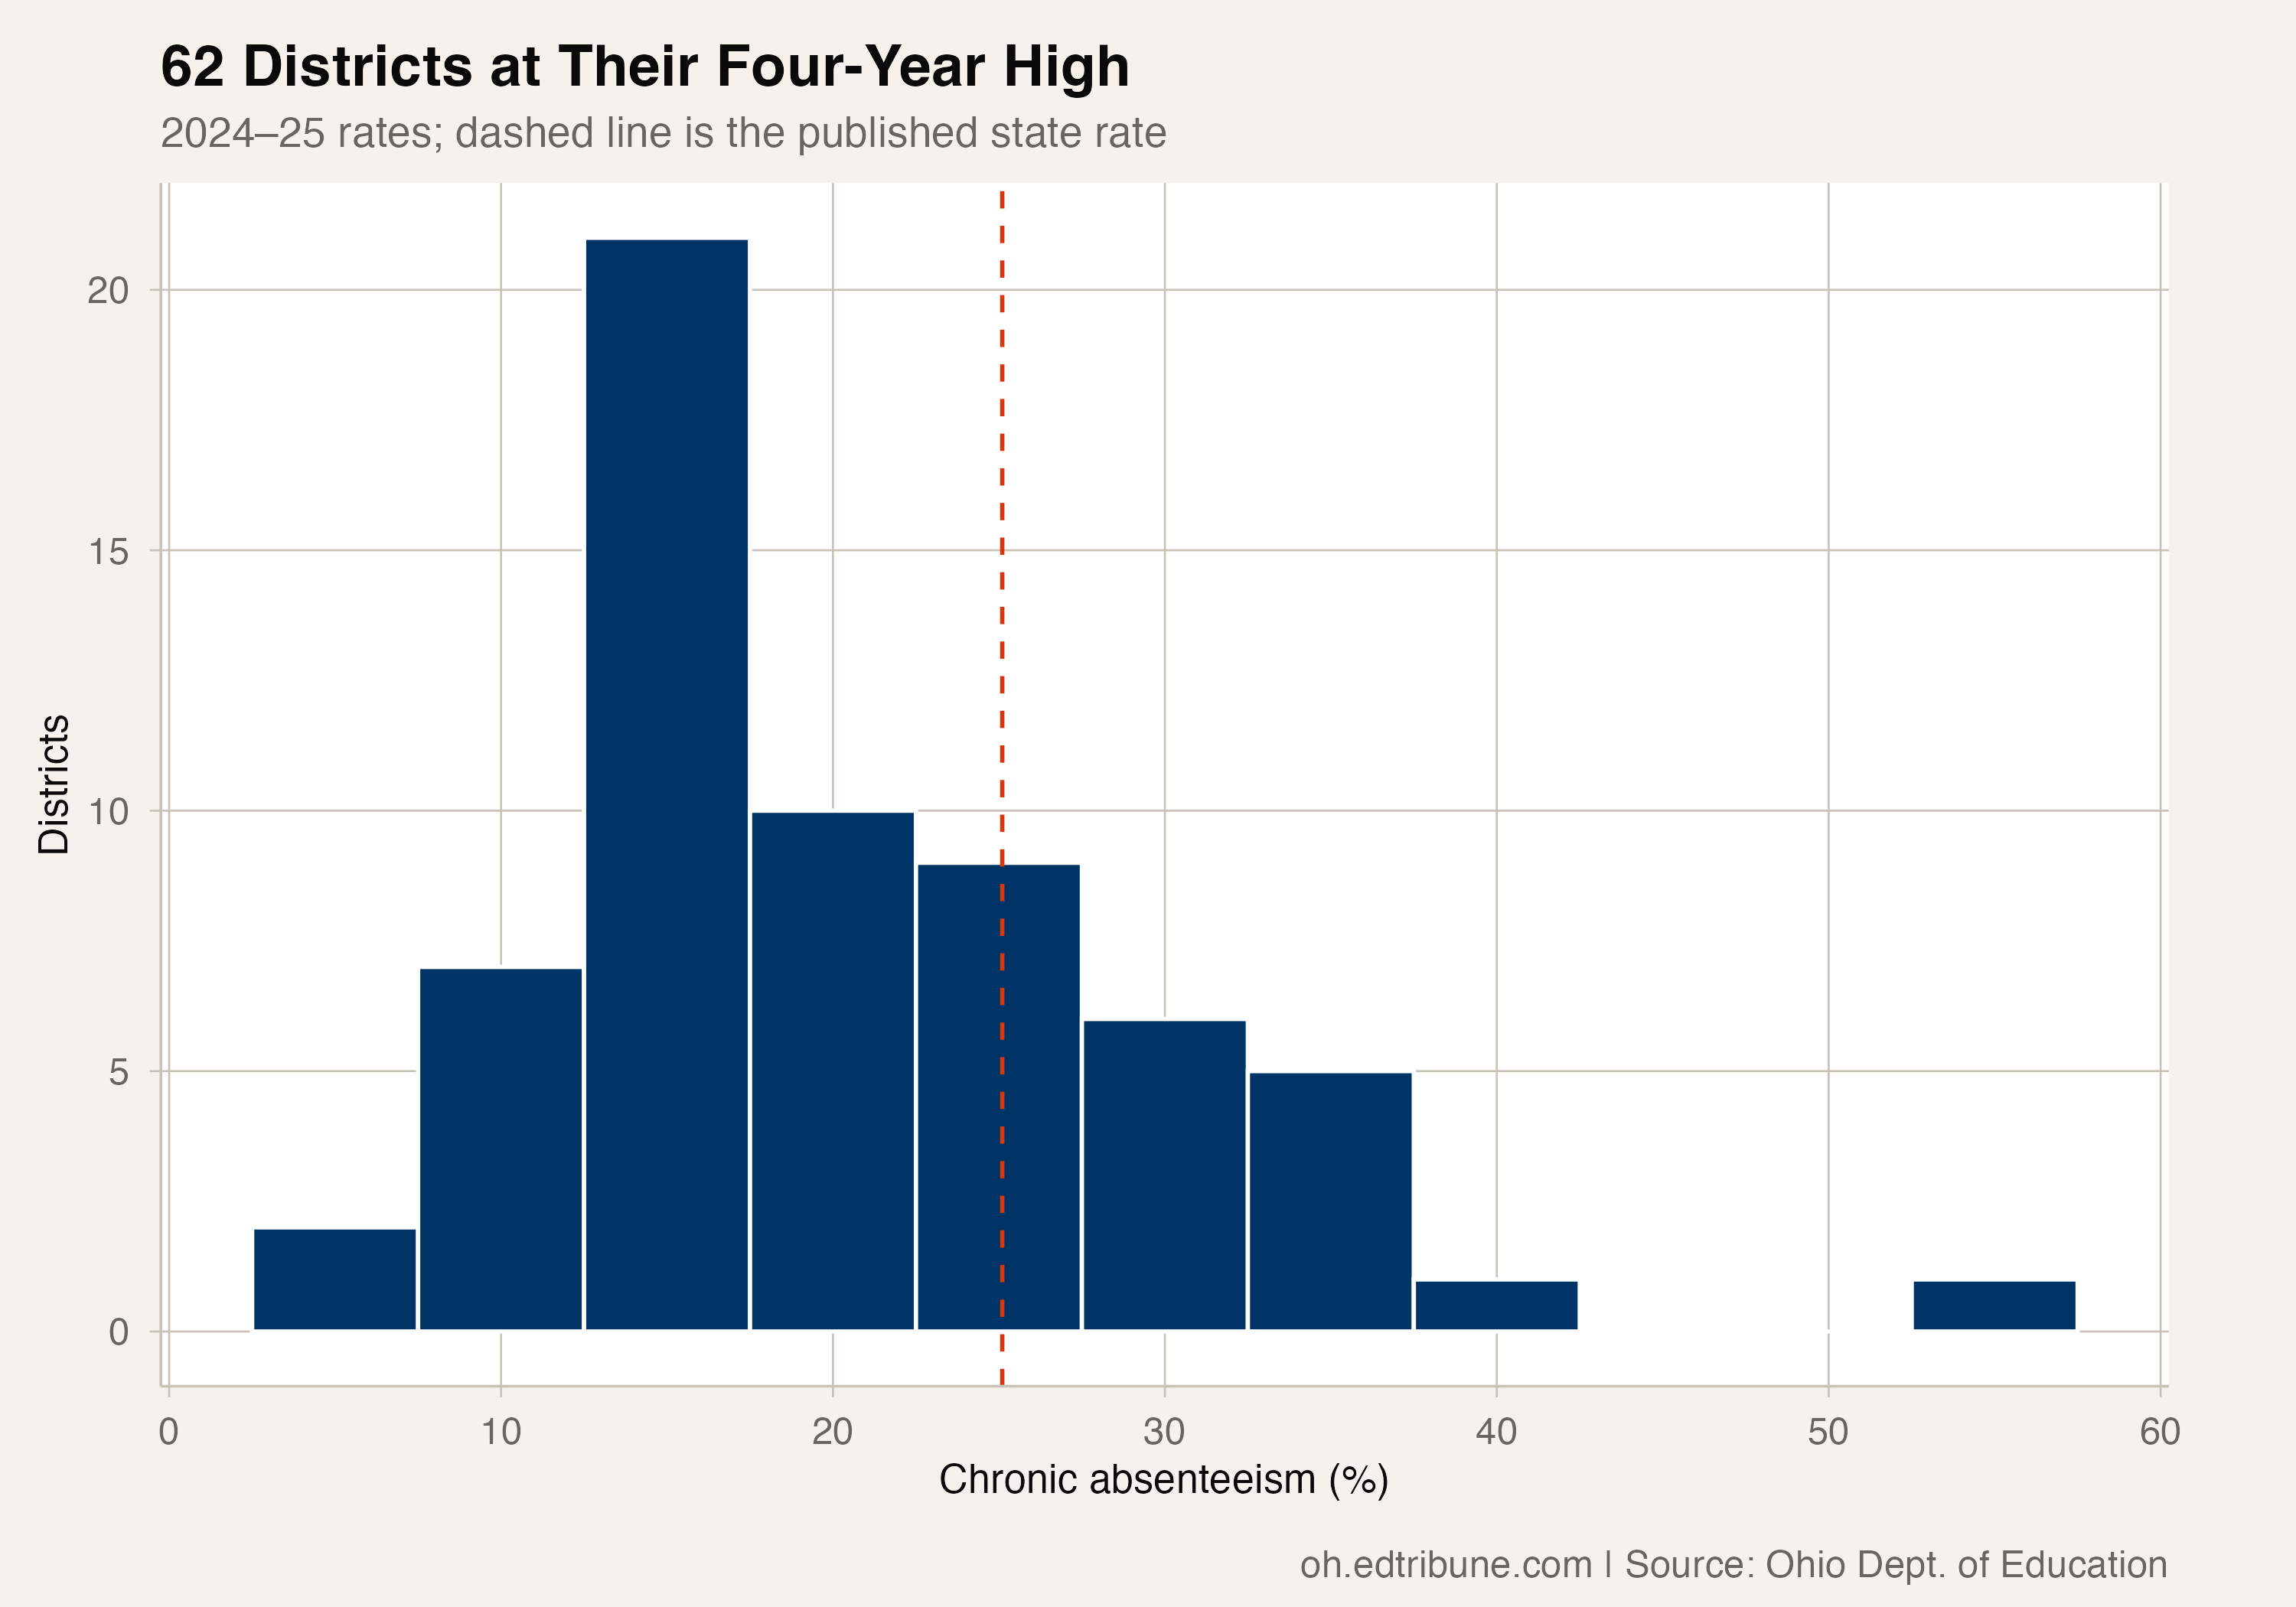
Ohio's statewide chronic absenteeism rate fell to 25.1% in 2024-25, its lowest level in the available four-year series. Yet 62 districts were at their own highest recorded rate within that same window.
Those districts represented 10.2% of the 607 districts with published rates in every year from 2021-22 through 2024-25. Their latest attendance enrollment totaled 134,077 students. The statewide improvement did not describe every district's experience.
What “highest” means here
The comparison uses each district's published rate across the full available series. A district is at its high if its 2024-25 rate equals its maximum, including a tie with an earlier year. That does not establish an all-time record, because this series contains no pre-pandemic rates.
Nor does reaching a high establish that a district worsened in every intervening year. A district can improve temporarily and then return to an earlier high. The annual direction has to be checked separately.
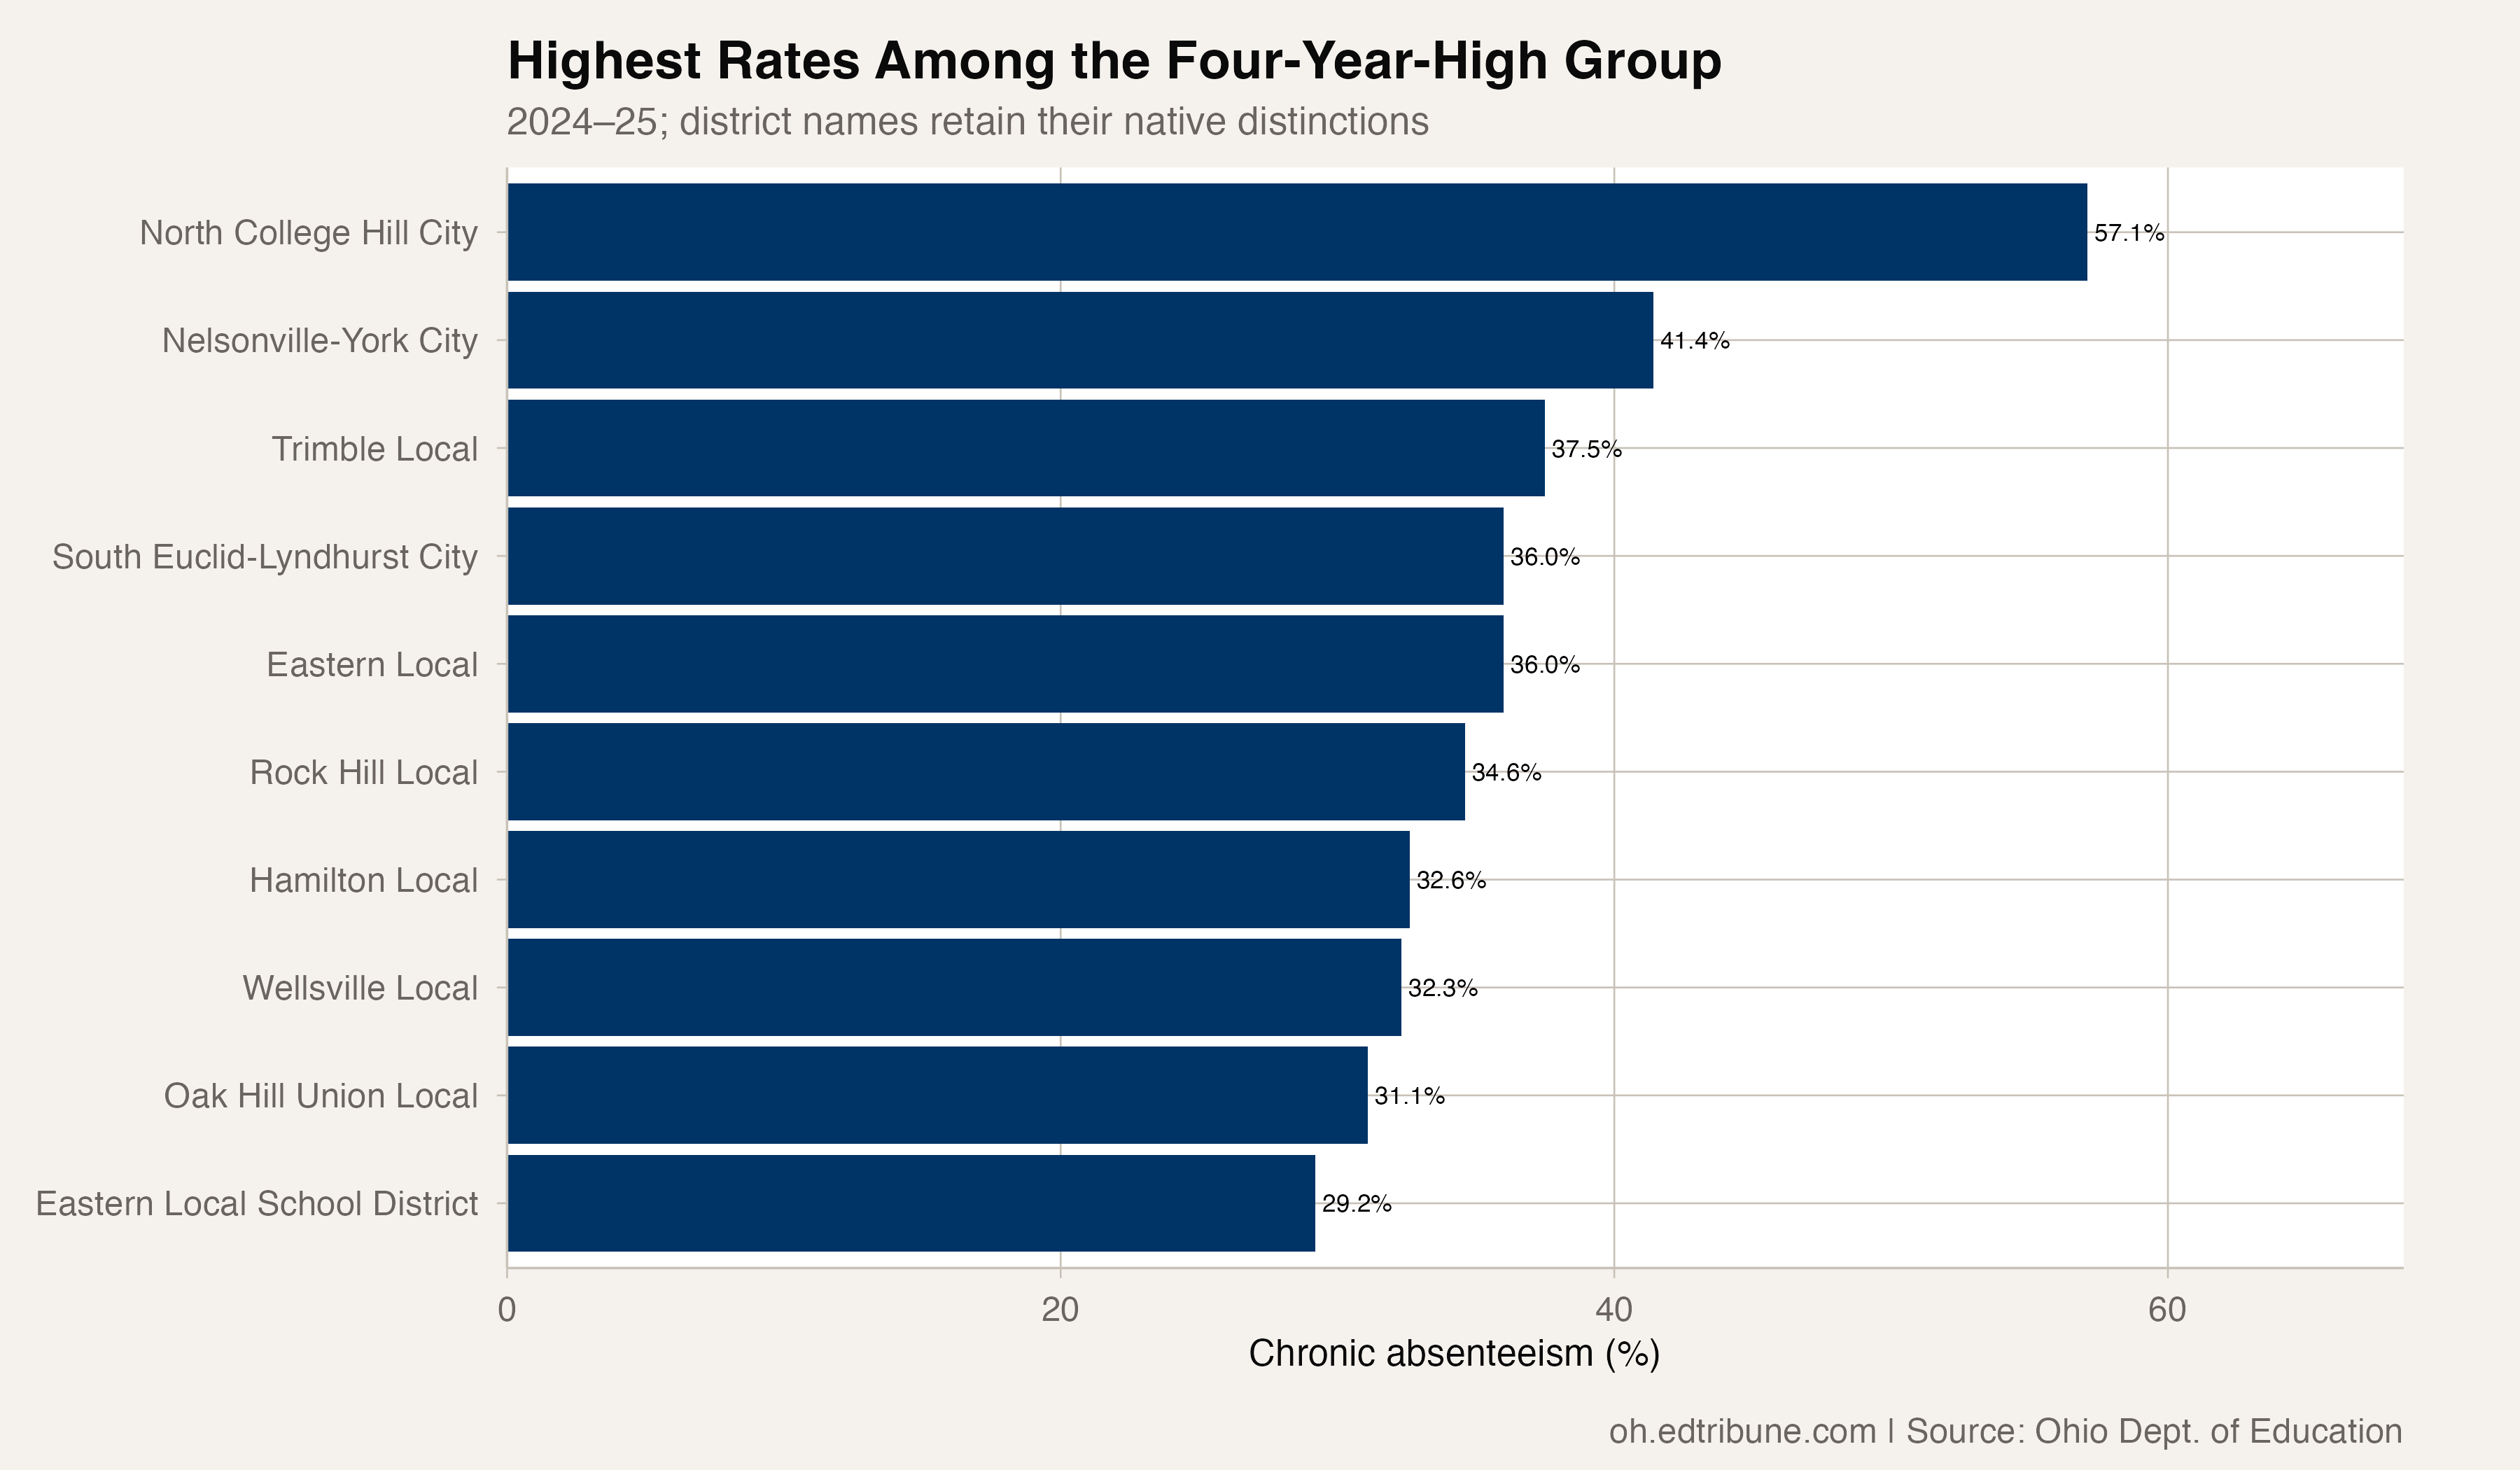
North College Hill City↗ET did worsen in every annual step in this window. Its 2024-25 rate was 57.1%, the highest among the districts at their four-year high. Other examples included Nelsonville-York City↗ET at 41.4%, Trimble Local↗ET at 37.5%, and South Euclid-Lyndhurst City↗ET at 36.0%.
More districts were at their low
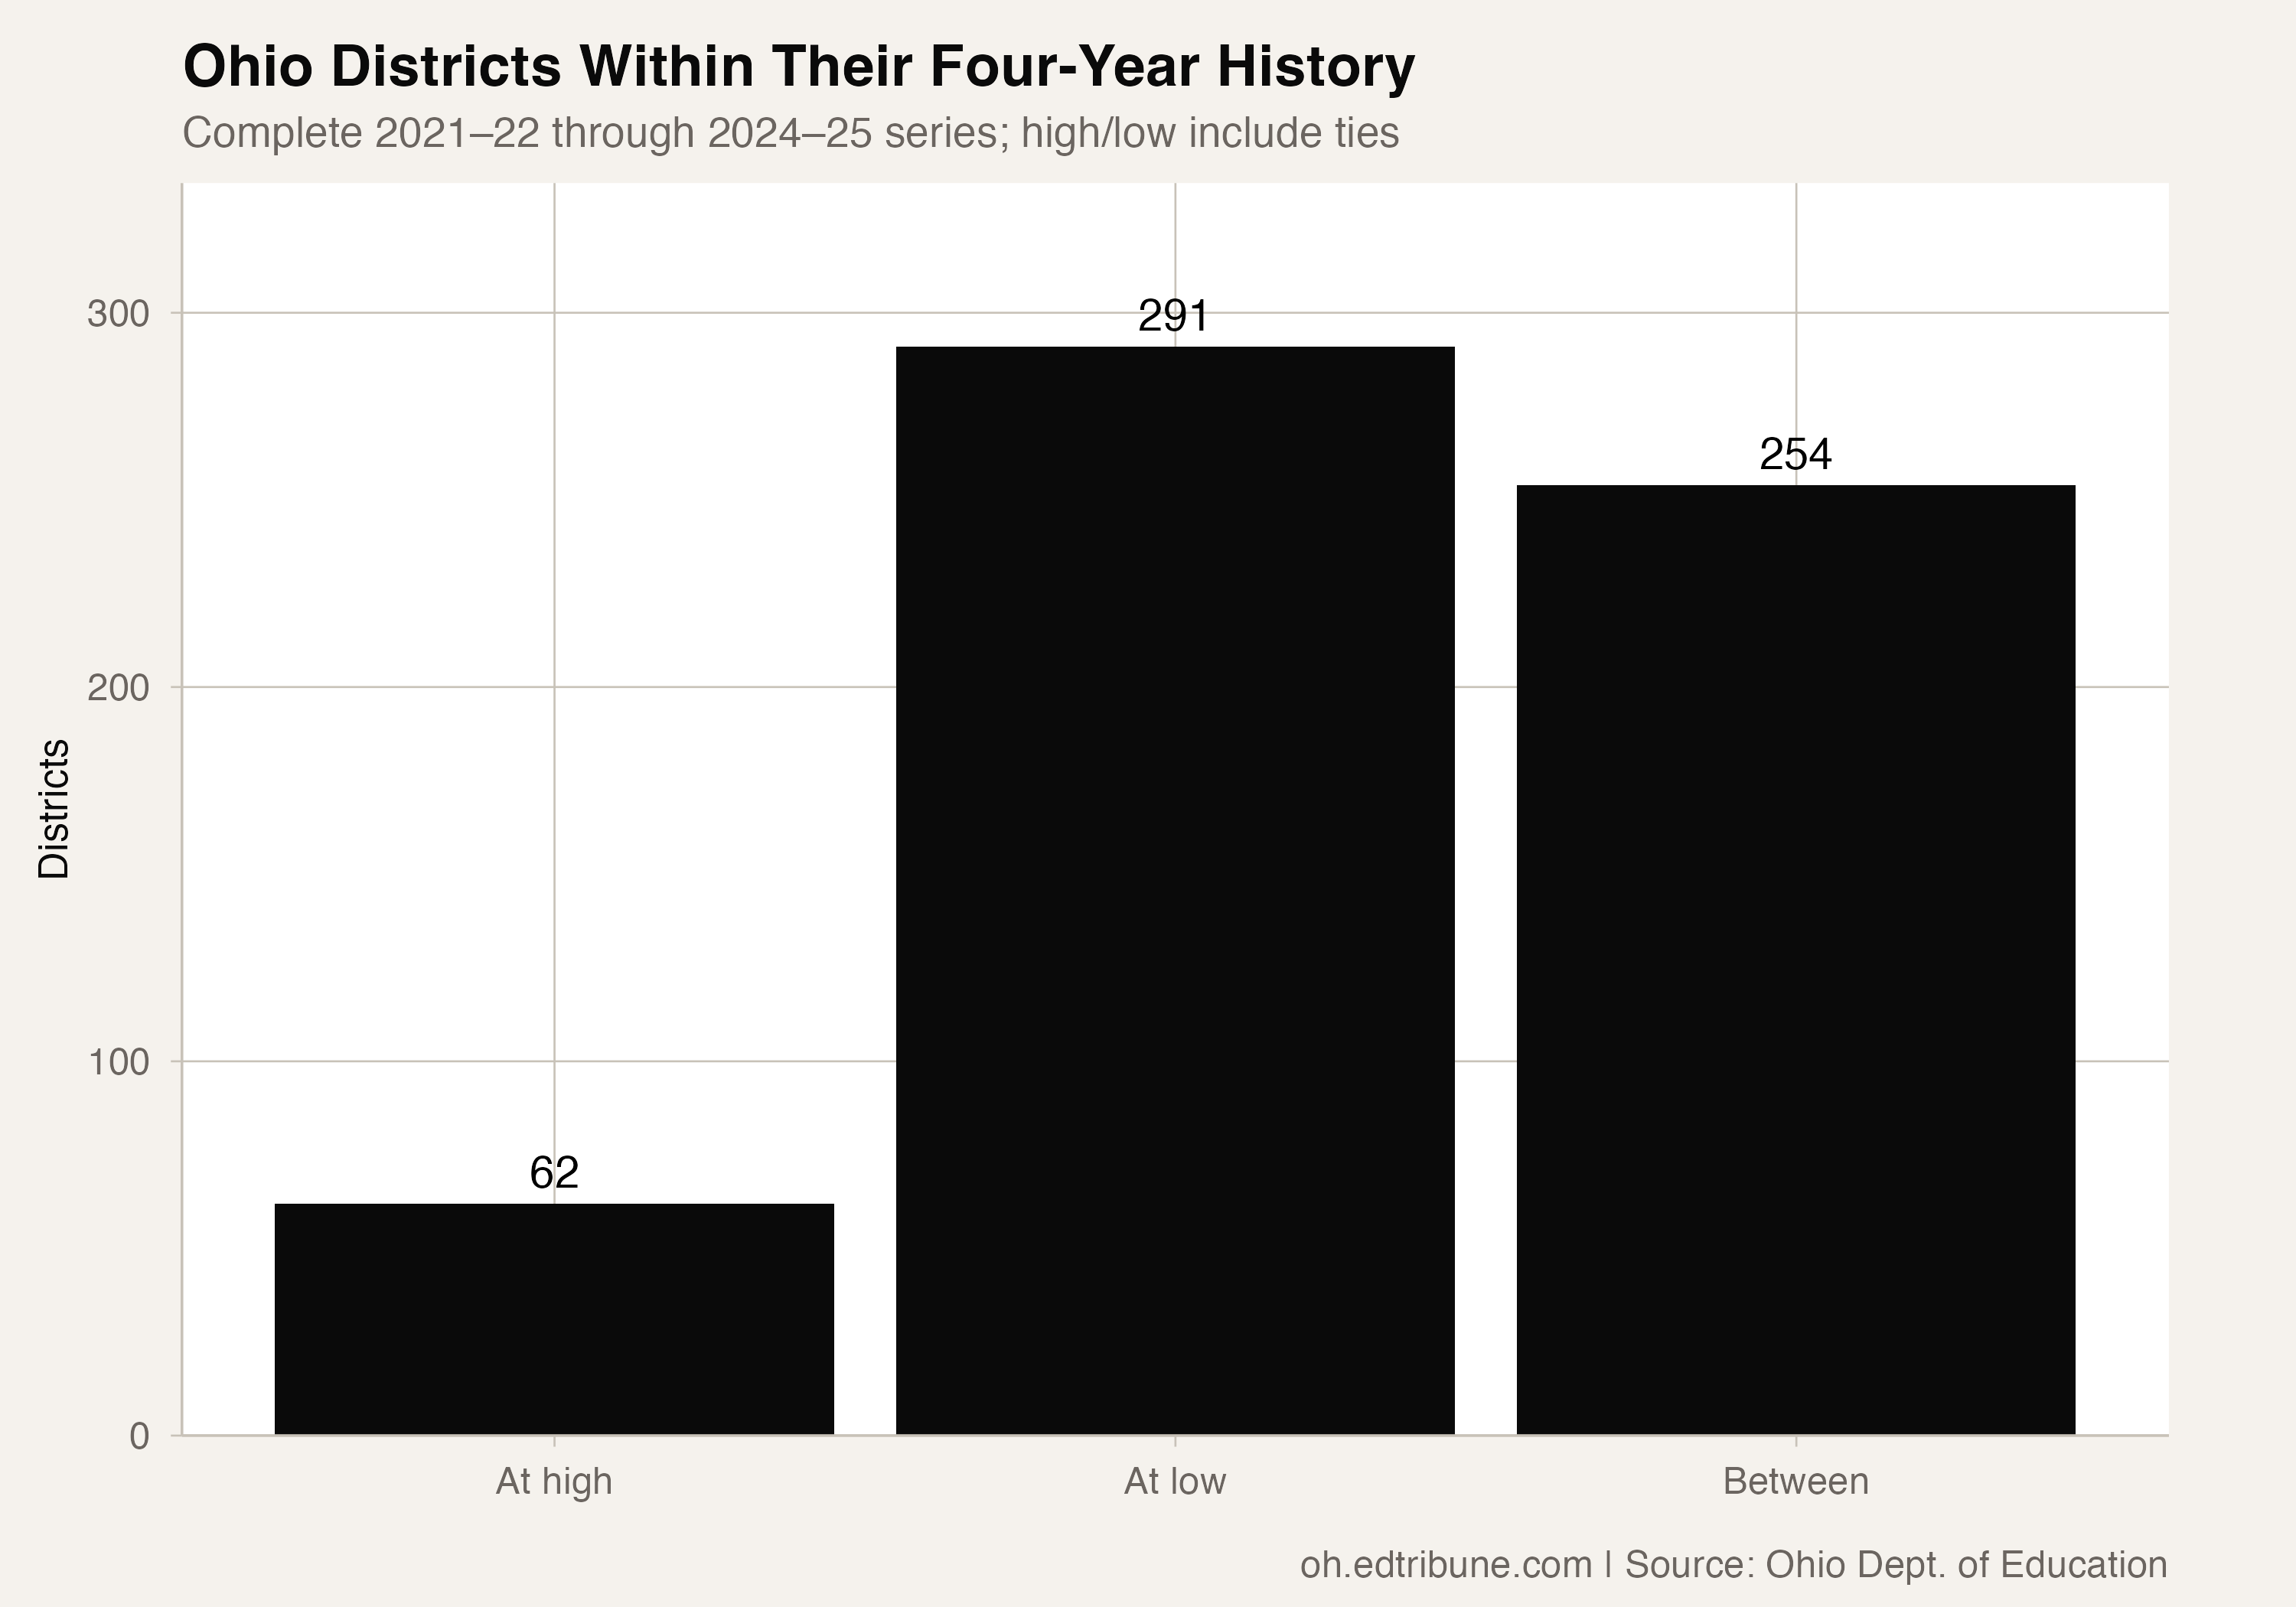
The same complete panel placed 291 districts at their lowest rate in the four-year window and 254 between their high and low. No district belonged to both endpoint groups in this comparison.
The state rate declined from 30.2% in 2021-22 to 25.1% in 2024-25. That establishes improvement within the published series. It cannot establish a return to pre-pandemic attendance, because the earlier comparison years are absent.
The high-rate group included larger districts
Of the districts at their high, 47 had fewer than 3,000 students in the published attendance enrollment. Most were below that size threshold, but the group also included larger systems.
Willoughby-Eastlake City↗ET reported attendance enrollment of 6,601 and a chronic absenteeism rate of 28.4%. Lakewood City↗ET reported 4,314 and 26.8%. Hamilton Local↗ET reported 3,231 and 32.6%.
Those counts are the enrollment denominators in the attendance files, rather than a claim about live enrollment this school year. They show that the districts at their high were not exclusively small systems.
The records do not identify why these rates rose, which local responses were tried, or whether additional resources would change attendance. They do identify a set of districts whose latest results differed from the statewide decline, providing a starting point for district-specific questions.
Detailed code that reproduces the analysis and figures in this article is available exclusively to EdTribune subscribers.
Discussion
Sign in to join the discussion.
Loading comments...